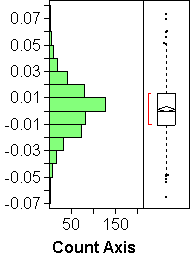
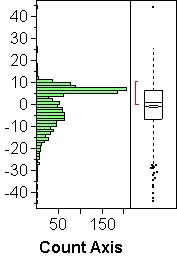
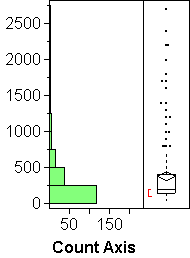
For continuous variables, JMP gives you a vertical histogram and a boxplot on the same scale. You can then ask for a normal quantile plot, which will be attached to the boxplot, so that all three plots (histogram, boxplot, normal quantile plot) share the vertical scale of the data.
- HISTOGRAMS:
The bars represent the frequency of observations in the intervals. A histogram shows the overall shape of the distribution of a variable: where is lots, where little. Things we can see well in a histogram:- MODES or humps or peaks of the distribution. In histogram (b) above we see two modes. The vertical axis represents returns of 1529 mutual funds in 1990; the upper mode shows essentially the bond funds that out-performed the much more volatile stock funds of the lower mode in that year.
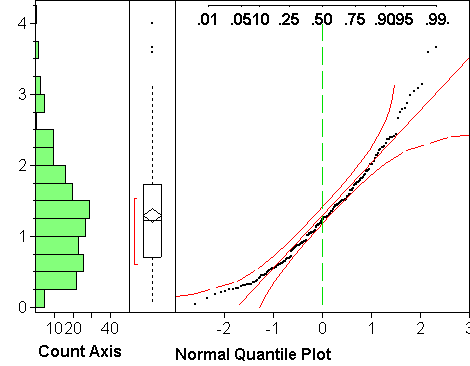
- SKEWNESS or asymmetry in the tails; one tail of the distribution is more spread out than the other. Skewness occurs often when the values are bounded on one side, such as zero. See histogram (c) above; histogram (d) is an extreme case of skewness.
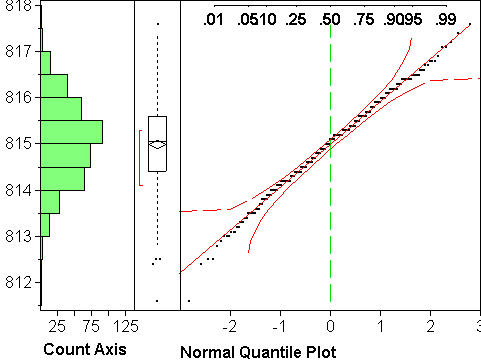
- NORMALITY (not really): If a histogram has only one mode, looks roughly symmetric, and doesn't have outliers, it may be an indication of an approximately normal distribution, as in histogram (a) above. But histograms are NOT the best way to check normality! Use normal quantile plots instead.
- BOXPLOTS:
Boxplots summarize mostly information contained in quantiles:- The box represents the half of the data between the lower and upper quartiles. Its height is therefore the IQR (inter-quartile range).
- The line in the middle shows the median.
- The diamond represents the mean and its standard error.
- The whiskers are drawn from each end of the boxes to a length of 1.5*IQR or the min or max, whichever comes first.
- Extreme observations outside the whiskers are shown individually, and they are thought of as potential outliers.
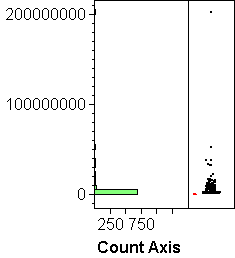
- OUTLIERS: The points outside he whiskers may be outliers (or not). In boxplot (c) above, the whole upper mode is shown as potential outliers because the lower mode near zero contains 3/4 of the data and hence determines the box single-handedly.
- SKEWNESS: A notorious indicator of skewness is a large discrepancy between the mean and the median. See boxplots (b) and (c) above; boxplot (d) is so ridiculously skewed that the box and the mean are both squished into the bottom ink.
- NORMAL QUANTILE PLOTS:
The only -- but important -- purpose of normal quantile plots is to check approximate normality of the distribution of a variable.JMP: First create a histogram and boxplot (Analyze > Distribution); then click on the red diamond next to variable name > Normal Quantile Plot. This has to be repeated for every histogram/boxplot you wish to augment.
Description: JMP's default normal quantile plot has on the vertical axis the values of the variable, on the same scale as the adjacent boxplot and histogram. On the horizontal axis are the theoretical quantiles of the standard normal distribution N(0,1). If the variable is distributed according to a normal distribution N(mu,sigma^2) (with arbitrary mu and sigma), then the dots will be near a straight line. The reason is that the observed quantiles of the variable (its median, quartiles, quintiles,...) will line up with the corresponding quantiles of the standard normal distribution according to the equation y = mu + sigma*x, up to sampling variation.
Interpretation: In those places where the points are close to the straight line, the theoretical and observed quantiles are in good agreement; wherever the points are substantially off the straight line, the agreement is unsatisfactory. In other words, the plot shows where the quantiles of the estimated normal distribution N(m,s^2) make a good approximation to the observed quantiles. If the agreement is good everywhere, one can replace the observed quantiles with those of the estimated normal distribution, which can be useful when estimating probabilities P(Y<c). Note that being (say) above the straight line means opposite things on either end: on the low end, it means the tail of the distribution is too short/light to be normal, on the upper end it means the tail is too long/heavy to be normal (think about it).
Assessment: The remaining question is how to tell good agreement. To this end, JMP provides two curves, one above, one below the straight line. If the points wander outside the area between the two curves, it is evidence against a normal distribution, at least in those areas. The curves could be closer to the line and still be valid, so stepping outside is indeed strong evidence against normality, while staying inside is not sufficient evidence for normality. Note that the area between the curves widens on both ends. Reason: Extreme quantiles are less reliably estimated than quantiles in the center. Extreme quantiles can vary more wildly without being evidence against a normal distribution.
Examples: Plot (a) above looks very normal. It's main failing is the staircasing, which stems from the rounding of the values to multiples of 0.1. Plot (b) shows upward or right skewness: The upper end deviates upwards from the line, and so does the lower end, which means according to the above that the upper tail of the distribution is too heavy, the lower tail too light. Points do not move outside the curves on either end, though, which might make us think the deviations are not significant. Skewness is clearly there, though, both in the histogram and the normal quantile plot. This example illustrates the fact that the curves are wider than they should be.
For ordinal and nominal variables, JMP gives you a vertical barchart and a spineplot on the same scale. Btw, JMP does not use the terms "barchart" and "spineplot"; instead, barcharts appear in menus as "Histogram", and spineplots as "Mosaic Plot". We prefer to reserve the term "histogram" for continuous variables and the term "mosaic plot" for bivariate frequency plots.
Besides the obvious use for frequency comparisons of groups, these plots have a particular use in data cleaning: it often happens that misspellings of group labels lead to the spurious multiplication of groups, as when the group labels should be "YES" and "NO", but some were coded as "Yes" or "no". A barchart or spine plot will quickly identify the problem.

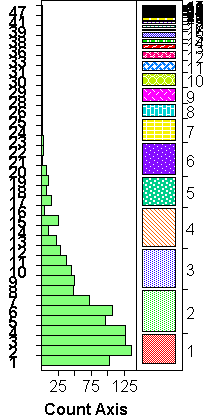
The examples above show barcharts and spineplots for ordinal/nominal variables with 2, 4, and many, groups.
- BARCHARTS:
Barcharts are similar to histograms, except that there is no choice of binwidth: the bins are the groups defined by the ordinal or nominal variable. The height of a bar is proportional to the frequency of cases in the group. For ordinal variables, groups are shown in order; for nominal variables, group ordering depends on the "Data Type" (R-click on column label > Col Info): groups are ordered lexicographically if the data type is "Character", and numerically if it is "Numeric". - SPINEPLOTS:
Spineplots convey the same information as a barcharts, just less well so: spine plots code frequency by the width, barcharts by the height of the bars. (Note, though, that the width is vertical, just as the height of the bars in barcharts is horizontal, due to JMP's vertical default arrangement).
- SCATTERPLOTS: X AND Y CONTINUOUS
Scatterplots show the values of pairs of continuous variables plotted as dots in Cartesian coordinates. Scatterplots may seem simple, but they are not, for two reasons:
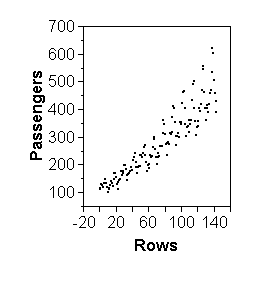
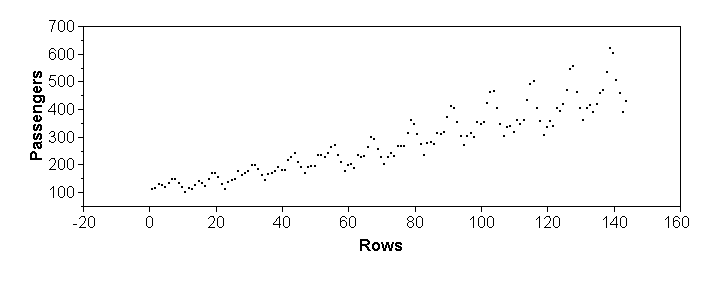
- There is a huge wealth of detail that can be read from scatterplots if there is sufficient data (n in the hundreds, say): monotone and in particular linear association, clustering, outliers,...
- Scatterplots are strongly affected by scale.
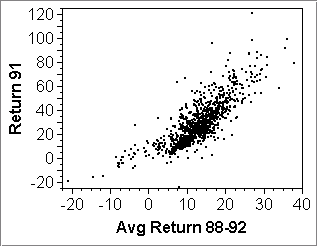
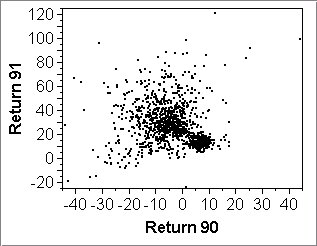
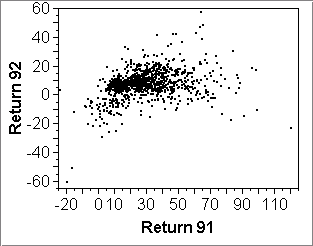
The first point is illustrated by the first row of scatterplots below. They show returns of some mutual funds data in various years, as well as average returns:
- Plot (a) shows a monotone increasing assocation, nearly linear, but not quite. The year 1991 seems to have been quite average.
- Plot (b) shows clustering: there is a concentrated cluster near 10% on both axes, representing bond funds; the other points form a diffuse cluster of stock funds with mostly lower performance than bonds in 1990, but mostly higher performance in 1991.
- Plot (c) shows no clear assocation between returns of 1991 and 1992.
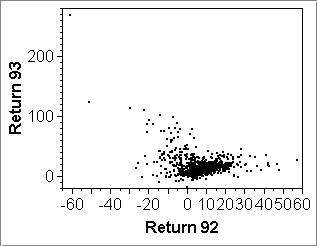
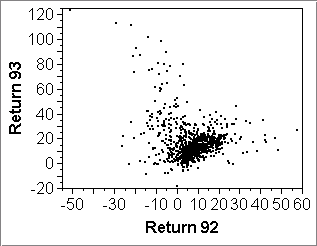
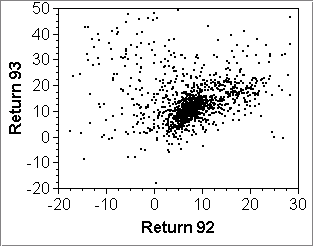
The second point above is illustrated by the second row of scatterplots below: The vertical scale of plot (d) is largely determined by a single stock that had a return of nearly 300% in 1993 (and about -60% in 1992). Removing this stock rescales the vertical axis to what we see in plot (e). Further removing stocks with returns above 50% in 1993 shows even more detail in the center where there is a weak linear association among the majority of less volatile funds.
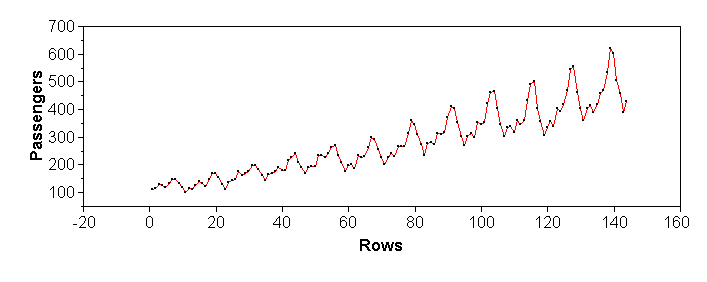
Time series plots are a special case of scatterplots, where the X-axis is time. For time series plots it is not recommended to use "Analyze > Fit Y by X" in JMP, but "Graph > Overlay Plot" instead. An advantage is that, as the name says, one can overlay multiple time series on the same time scale. The plots below illustrate the sensitivity of scatterplots to scales again: all four represent exactly the same set of numbers. The issue of scale is less aggravating when the points are connected, as shown in the bottom row.
(a) (b) 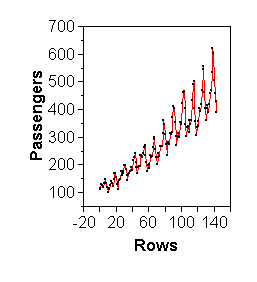
(c) (d) - COMPARISON PLOTS: X ORDINAL/NOMINAL, Y CONTINUOUS
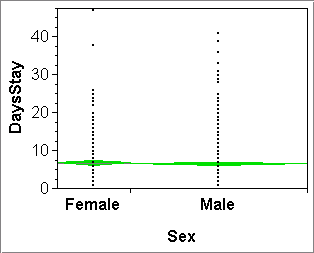
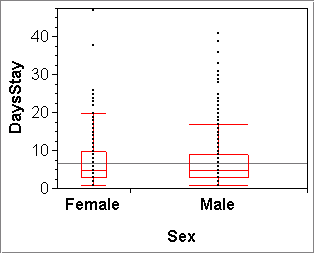
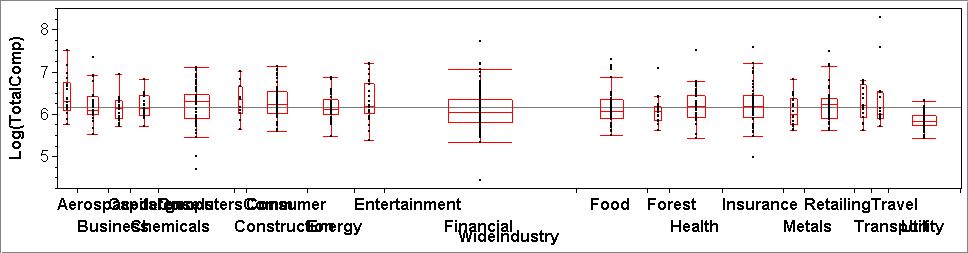
Comparison plots allow us to compare the values of a numeric variable (Y) across the groups defined by an ordinal/nominal variable (X). (They are also called "one-way analysis", which is what JMP puts at the top of the plot.) The simplest comparison plot has an implicit separate vertical axis for each group; it shows the Y-values as points on these axes.
The plot can (and should) be augmented, for example, by showing group means and their standard errors, as in plot (a) below. Or, often more usefully, it could show groupwise boxplots, as in plots (b) and (c). For the latter, R-click on the red diamond > Display Options > Box Plots. Now one can compare the medians, quartiles and IQRs across groups. The boxplots contain one more piece of information: their widths are proportional to the numbers of observations in the groups.
The three plots below illustrate the simplest case of a nominal X-variable with just two groups in plots (a) and (b) (they show the same variables), as well as a case of numerous groups in plot (c). The latter shows for example that the financial industry is the largest group, and the utility industry (right most) has the lowest-paid CEOs.
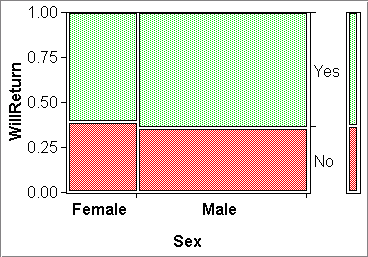
- MOSAIC PLOTS: X AND Y ORDINAL/NOMINAL
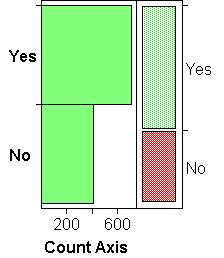
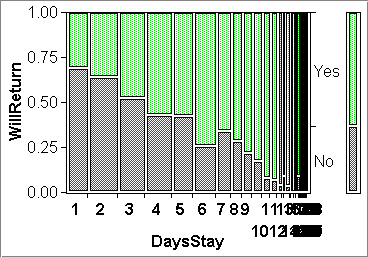
Mosaic plots solve the problem of comparing an ordinal/nominal Y-variable across the groups of another ordinal/nominal X-variable. For example, mosaic plot (a) below allows us to compare the frequency of hotel guests willing to return across the two groups defined by the sexes. In effect, we see two spine plots side-by-side, one for "Female" and one for "Male". The fact that they are side-by-side makes them powerful tools for group comparisons. (Recall that spine plots in isolation were not very powerful; histograms clearly beat them.)
Note that the width of the spines is proportional to the size of the groups of the X-variable. In plot (a) we have less than half as many females as males.
The mosaic plots below illustrate cases where the X variables represent two, four, and many groups. Plot (b) shows that the Y-variable can have more than two groups also.
Plots (a) and (b) are essentially "null plots", that is, there is no discernible structure: knowing the X-group, we really know nothing about the distribution of the Y-groups. In other words, X and Y are likely to be independent. Whatever small differences we see, they are probably due to random variation. We know this for sure for plot (b), because X and Y represent independent simulations of chips drawings with frequencies 0.5, 0.3, 0.1 and 0.1 for outcomes 1, 5, 10 and 20.
Plot (c) is highly interesting because it shows a monotone assocation between the ordinal X-variable (numbers of days stayed) and the frequency of being willing to return to this hotel. (Note that the X variable had to be made ordinal first; it was originally continuous.)
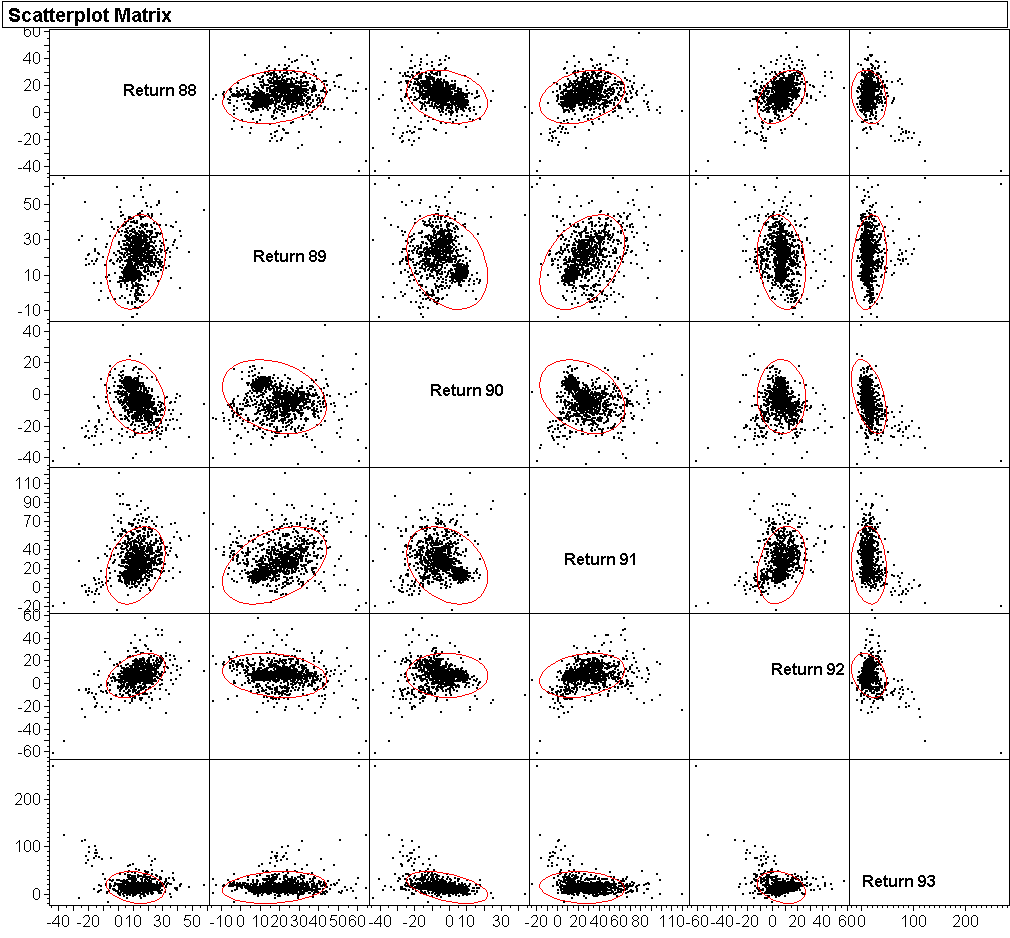
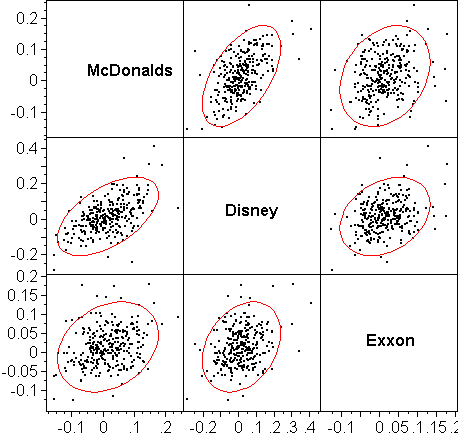
MULTIVARIATE PLOTS: SCATTERPLOT MATRICES
A scatterplot matrix is the collection of all possible pairwise
scatterplots of a set of continuous variables. They are created by
"Analyze > Multivariate" and picking a number of continuous variables
as Y's.
Scatterplot matrices take some getting-used-to because of the way the axes are labeled. The example below illustrates the conventions: In the first column, McDonald is the horizontal axis; in the second column it is Disney;... Analogously, in the first row McDonalds is the vertical axis; in the second row it is Disney;... Each pair of variables is shown twice. For example, Disney vs McDonalds (Y vs X) is the first plot in the second row. The reverse, McDonalds vs Disney is the second plot in the first row.
The plots are augmented with ellipses that cover 95% of the data. The narrower the ellipse, the stronger the linear association (correlation) between the two variables. We see, for example, that McDonalds and Disney has the highest correlation among the three possible pairs.
The following example illustrates the power but also the need for real estate for scatterplot matrices. We are shown plots of returns, year vs year, from 1988 to 1993, for 1529 mutual funds. Because much of the interesting structure (clustering, outliers) is not of the type of linear association, the ellipses are mostly not useful; they could have been removed.