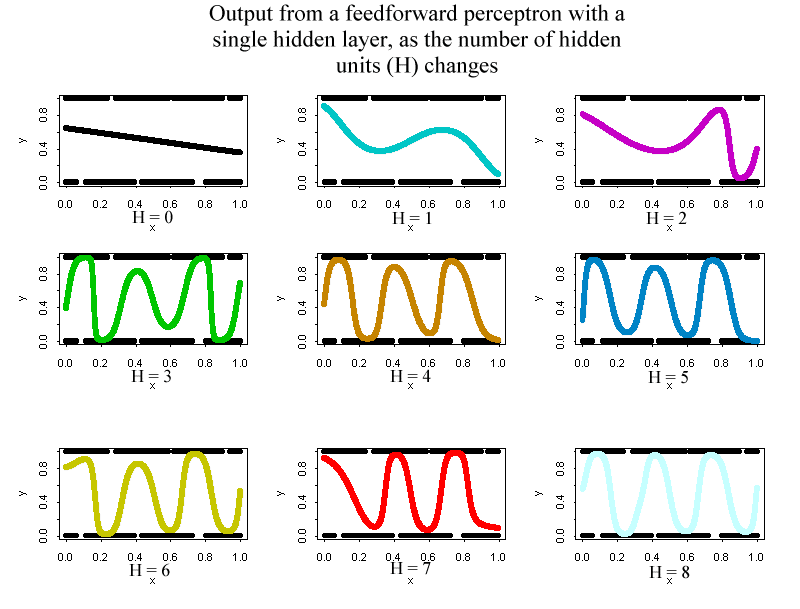

Graph 2. The following graphs illustrate the ability of the neural network to capture non-linearities. The scenario is that there are two groups in the population. The probability of being in group 1 varies with the sin of x. The aim is to capture from the raw 0/1 data how the probability of group membership depends on X. Each graph shows the predicted output from a one hidden layer neural network as the number of units in the hidden layer varies from 0 to 8. Note how the network is able to capture the non-linearity so long as the number of hidden units is large enough. The approximation to the sin curve appears to improve with the number of hidden units.

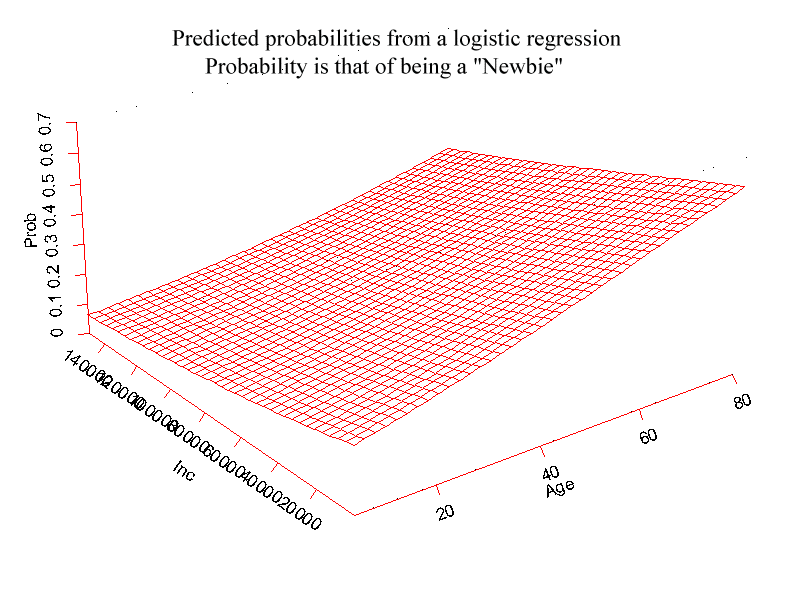
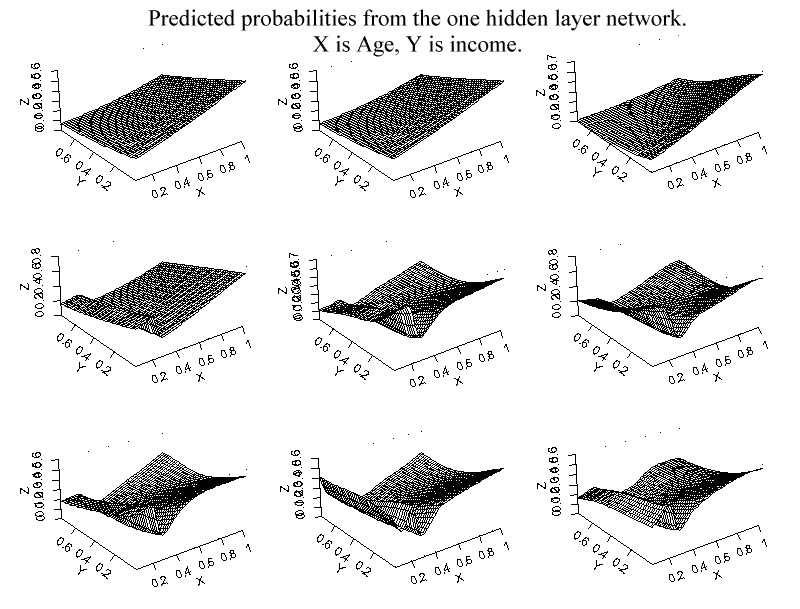
Graph 3. In this graph the predicted response probabilities are calculated for the internet demographics datset, but this time from a set of neural networks in which the number of units in the hidden layer varies between 0 and 8. Notice how the smoothness of the surfaces decreases as the number of units increases. This figure should be contrasted with Graph 1. Graph 3 shows both the value of the network which has the ability to capture non-linearities or "wrinkles" in the suface, and also one of the issues associated with highly non-linear models: which of the wrinkles are real, and which are a result of overfitting? In this particular dataset, a possible explanation for the ridge associated with younger people is the impact of easy access to internet links that undergraduate students enjoy. Validating the network on out of sample data is one way to go about answering the fundamental question concerning the "realness" of the observed non-linearities..

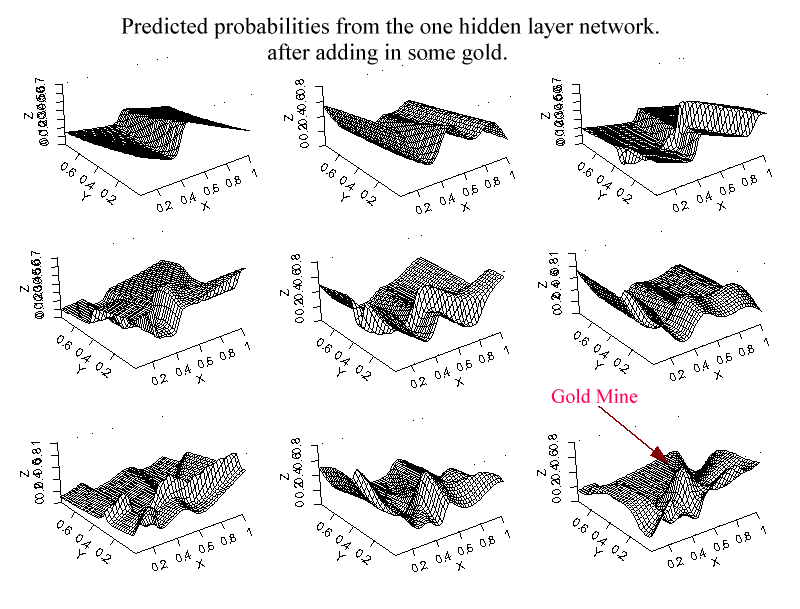
Graph 4. This graph again plots the predicted probabilties from the neural network, but this time after the demographics dataset has been manipulated to include some "gold". In this case people with ages between 35 and 45, and income sbetween 35,000 and 45,000 were recoded as 1's, that is as newbies. This inserts a spike into probability surface. With enough hidden units the network is indeed able to uncover the gold.


Richard Waterman. waterman@compstat.wharton.upenn.edu