This Spring Term graduate course is about financial time series --- in two complementary respects. First it engages all the usual data and the associated theoretical models, just as one would expect. Second, it looks hard at the algorithms that are used to estimate these models. In some cases, there is considerably more subtlety to these algorithms than many analysts recognize. Finally, to make the two themes lively, the course looks at a variety of assets. We'll certainly spend some time trying to understand such phenomena as" sector rotation" (if it exists). We'll also dig into some understudied assets like closed end funds and structured products. These are often found to exhibit interesting (and anomalous) behavior in comparison to more classical (and more "efficient") assets.
Course Blog
Day 26: Perspectives and Possibilities
Reminder Final Project Presentation and Papers. We will have final project proposal presentations on Wednesday April 22 and Monday April 27. Please be prepared both for your own presentation and to be an active participant in the conversation that follows the proposals. Everyone is expected to be an active contributor in these two presentation days. Your final papers are due on Monday May 11.
Facts, Tools, Tricks, and Theories
At the heart of what there is to be learned from financial time series are the stylized facts. We'll take a look back at the nice survey of Rama Cont. This covers the fundamental stylized facts of financial time series, and, if we were going to have a final exam, at least a quarter of the questions would come from this survey.
- We will also look at some important facts that are not part of Cont's survey.
- The Three Factor and Four Factor Model
- The power of beta --- even for those who are no fan of CAPM
- It is easier to model spreads than the "market"
- The presence of momentum at various levels
- 50 day and 200 day SMA's "work"
- Leading Sector rotation "works"
- Is there really a risk story behind this "working"?
- The dangerous (but interesting) suggestion of mean reversion in special situations (Equity pairs? Maybe. Credit spreads? Even a scarier maybe).
We'll next recall the features (good and bad) of the elements of our technical toolkit --- basically our models. All time series models require stationarity and in 2008-2009 this came into serious doubt. We can't hide from this fact, but we also should not be driven into the back of a cave.
We learned an important lesson. Don't Be Stubborn. If an analytical game that has worked for you in the past is not working, it is perfectly correct to bail out and wait for another day. Institutionally this is difficult, but 2008 was a long story in seeing how people doing what was institutionally easy cost them (and others) a fortune.
- Given stationarity, as we were given it it the past, we can do a lot --- though not everything.
- First, normality is almost always a stinker. We see this with the JB test (insert David Babble story).
- There a covert appearances of normality --- basically anywhere least squares substitutes for honest maximum likelihood. This is ubiquitous in ARIMA. Scary, but probably not disabling. To do better, you'd need massive coding.
- Our models must be consistent with the lion's share of the stylized facts.
- Volatility varies with a certain amount of predictability. This means that GARCH models and their generalizations have a claim on our attention.
- There are alternative stochastic volatility models to the GARCH. In option pricing theory, these seem bogus to me (incomplete market), but they are in some ways more honest --- shocks can be truly exogenous.
- Our benchmark model is Garch(1,1) in noise and AR(1) in mean. It is not perfect, but it probably gets you 75% of what could ever be gotten.
- To squeezes the rest, you can at parameters to AR(2) or AR(3) and you can take leverage into account, say with a threshold garch model.
For lack of a better word, we also considered a certain number of "tricks" --- though this sort of word is not one that is warmly welcomed in financial services. Understandably, the jury has not spoken with a clear voice on some of the tricks, but on others the evidence from non-financial fields is compelling.
- Get graphical which ever you can. For example, if you have six strategies each of which was tried out over 10 time windows, you will see more from a box plot than you would ever see from a table. Let the strategies determine the boxes and the returns determine the values. A simple trick, but one that will save your cookies.
- Papers with few or no graphs are much more likely to be bogus than papers with lots of clear, well labeled graphs. We have a hard time tricking ourselves with a picture. In particular, with any strategy, we really do need to have a look at the wealth process. These are best if plotted in groups and with colors for the different strategies.
- Be at least somewhat systematic in picking parameters. We've recently reviewed this, so I won't go over it now, but it is a good idea to look at the summary.
- When it comes to bet sizing, the natural starting point is Fractional Kelly. The alternative would be the Markowitz "what level of pain are you comfortable with" approach.
- Rebalancing. Rebalancing, like Churchill's Russia, is a mystery wrapped in a riddle. So often it "works" --- and this must be mean reversion --- yet testing for mean reversion does not "work." The news you can use here is to always take some form of a simple rebalanced portfolio as one of your benchmarks. For example, in a sector strategy, you'd like to know if you beat equal weight rebalancing. It's typically tougher than buy-and-hold (though the comparison is not 100% fair).
In addition to our basic stylized facts, or fundamental technical tools, and grab bag of tricks for doing financially relevant data analyses --- we also have some "theories" --- although theory is a pretty fancy word for what we've got. At the heart of the theory is the notion, empirically born out, that timing the over all market (relative performance of stocks, bonds, cash) has been struggled with and all we know is (a) it is either impossible or (b) the 200 day SMA saved you a chunk TWICE in history. To be fair, several market timing methods do seem to bring down volatility --- no small thing. With this level of efficiency as out back drop, we need to dig deeper. Where is the cheese?
- Counter Party Theory.
- If you have a counter party that is not profit motivated you have a shot at a good Sharpe ratio. The classic is the Japan carry trade.
- Sometimes you have counter parties that are naive. Typically you have to engineer this, and typically the naive customer is a retail customer --- though not always.
- Ex 1. Nuveen and "managed distributions"
- Ex 2. Exchange traded notes (camouflaged puts)
- Ex 3. Mutual funds with in appropriate fees
- If you can't participate directly in the profits from engineering --- you may be able to profit from the secondary market, especially as an engineered product is orphaned.
- CEFs and their retail base make an interesting hunting ground for "counter party" cheese.
- Piling On Theory
- The simplest example is in risk arbitrage. Today, for example, Oracle announce that it would buy SUN Microsystems. There is a big pop, and this will settle out -- probably by 10:30 or so. Now, is there profit to be made by piling on after the pop? One suggestion, born out by analysis, is that yes, this still "beats." There are several sides to this.
- A Little Il liquidity Thank You
- Typically the investor has been paid to accept a little il liquidity. The leading example is the excess return to small cap stocks.
- Here as always there is a risk story to go with the reward story.
- Other places where this is sub-par liquidity have also provided (most of the time) a little excess return
- Convertible Bonds
- MLPs
- Strange REITs (NLY)
- Less Strange REITs.
- TIAA Real Estate Fund (not the mutual fund)
- Directly held municipal bonds
- Junk Bonds
- Distressed assets
- In most of these cases, analytical work is needed --- but even throwing darts picks up return on a risk adjusted basis (though future returns may vary).
- Conglomerate Theory
- Here the motivation is economic, not empiric --- and empirically it seems not to work worth a damn.
- The idea is that the CEO of a diffused conglomerate like Illinois Tool Works is a "portfolio manage who can trade on (what otherwise would be) inside information."
- To balance this, there is also liquidity risks to this managers assets.
- History? Conglomerates do great when their PE ratios are high and they can do acquisitions that are accretive to earnings --- and this has nothing to do with my "asymmetric information" story.
The big picture: We have stylized facts, analytical tools, tricks for data analysis and portfolio formation. We also have some evolving theories that may help navigate the shoals of market efficiency. This may seem like a modest package, but is more sustained and more trustworthy than the package that is used by most of our competitors and counter parties. Happy hunting!
Sidebar: Notes on a Recent Wharton Symposium
Last Thursday and Friday I was a participant in the Wharton Symposium on "The Measurement of Low Probability Events in the Context of Financial Risk Management" I'll give you a brief reprise of (1) the technical content, (2) some of the prevailing sub context, and (3) my sense of where this discussion is taking us.
Sidebar: Research Agenda for Mid-Sided Boutique
Suppose that you are a mid-sized investment advisory firm who is now looking for themes that would be attractive to customers --- say family trusts from the mid-size to the biggest. What I get from friends of Wharton, is that people are looking for answers to the question: "We're patient money, we need a 20 year time horizon, and even a 65 year time horizon makes sense for us. We see money darting left and right after each new, new thing. We think that there should be "excess return" or "risk compensated return" to those people who take another view --- an honestly long term view. What should we be doing?"
If you can give a thoughtful, no-too-conventional answer to this question, there are people who are interested. What is needed is sustained reasoning, and detailed attention to the "things that could go wrong." This is not an easy final project, but it is a conversation that we should find worth having. Both now, and later.
Sidebar: Human Talent is Long Tailed... and Surprising
Got Talent is a world-wide television franchise that works in the US, the UK, and in many other markets --- some yet to be franchised. Here the Wharton Follies serves to remind us that we are surrounded by people with remarkable talent. Here's a 4/9/09 clip that reminds us how we can underestimate the talent of others; it can tear up more than the average number of eyes.
Day 25: Everything I Know about Prediction
We'll I like the title, and I like the conversation. There are also a fair number of points to be made that are not a ready part of the collective consciousness. We'll start with a list that aims to short out all the situations that make prediction easier, or harder.
For a completely different look --- and one that I think is goofy but amusing, take a chance to look through the book Time Series Prediction by Weigend and Gershenfeld.
This is a proceedings from the Santa Fe Institute in the Science of Complexity. Smart guys doing crazy things, Michael Crichton sort of stuff.
Final Project Proposal Presentations
We'll formalize the teams and get commitments for dates. Please see the previous announcements of dates and times. Everyone should make every effort to attend and listen thoughtfully to the proposals that are made by your friends and colleagues. There is a collective responsibility for everyone to make everyone else's project the best it can be.
Sidebar: Brief History of David Dreman
You might want to look at the Bloomberg piece on the firing of David Dreman. This fits into several themes: "It really is different this time", "always bounce back", and the life of a contrarian --- as opposed to a momentum guy.
Sidebar: Cramer Steps in It (4/13/09)
Sure, everyone listens to Cramer from time to time --- and from time to time he has a idea worth considering. This evening, he really messed up big time. The conversation pivoted on REITS, Royalty Trusts, and MLPs. These are big dividend payers and Cramer suggested that they belong in sheltered accounts like IRAs, 401(k)s or 403(b)s.
This is a major blunder. First, MLPs and Royalty trusts are already "tax advantaged" --- you get the pass through of depreciation and depletion tax credits. This a good thing. Typically you get a fat dividend and you have credits to off set the dividend (though now there may be AMT considerations --- this is where I will be sloppy).
REITs on the other hand are simpler, they really do belong in the sheltered accounts. Also, if you own a wad of MLPs or Royalty trusts in a sheltered account you may be subject to a special "unrelated business tax" --- which can trigger charges from your broker and which can be substantial (a few hundred bucks) --- even just for the filing --- no to mention the tax itself.
Bottom line: Whatever you think of Cramer's clowning around, he certainly did not do due diligence this time. Any research on this topic would have at least made him think twice --- but he shot from the hip.
Day 24: Three Bars and ... You're Singing
This is the Sunday evening preview. It may well change by class time, but the plan looks like a review of three sidebars. They are given below, but to introduce them let's note:
- The same algorithm that motivated Google Page Rank has lots of variations and applications. It can be used to rank football teams --- or banks, or asset managers.
- There are lots of papers "out there" and it is usually pretty easy to "sort their hash." Still, sometimes you need a little extra nudge in one direction or another. That is what we address in the "Bogus" sidebar.
- Next, there is nothing more important than picking your parameters. We've seen a trick or two. Now lets work toward putting ALL the tricks together to see if we can be more systematic than the average rabbit.
- Finally, from here on out, we need to ramp up the conversation about the final projects. We always have time in class for you to discuss your idea. Don't worry if it is not fully formed --- that is what class discussion is all about.
- Final project dates. In particular, we'll have final project proposal presentations on April 22 and April 27 (our last two classes). The projects themselves will be due on the Monday May 11. You may want to review the blog post on project design.
Sidebar: Football Pools and Google Page Rank
I mentioned in class that the original page rank idea of Google founders Serge Brin and Larry Paige was based on an idea that had appeared much earlier with the down-to-earth aim of ranking football teams. I hunted down the 1993 SIAM paper where I first saw the trick, and it is richer than I remembered. I think there could be investment juice here, or at least management juice. If we put our heads together we should be able to get something good out of this.
By the way, you could subtitle this sidebar "The Old Goat Thinks He Invented Google." You see the story goes like this. When the SIAM paper came out, I talked it up (just by way of entertainment) in various places --- including Stanford, which I had left just a few years before. There, the little seed that I planted (or perhaps 10^4 others planted), eventually grew into public consciousness and finally into the empire that controls the world.
Logical disclosure. Simply due to computational complexity the page rank algorithm originally presented by Brin and Paige cannot possibly be the algorithm used today. Also, many SEO tricks were crafted based on the original proposal, so to knock off the black hats, Google has surely added trick and traps. Incidentally, the notion of black hat is a basic one in the SEO world. There are huge conventions, cult idols, and CIA operatives all mixed in the soup.
Sidebar: How to Tell if a Paper is Bogus
The nice thing about purely academic papers is that they are very seldom purely bogus. They can be boring, or be sloppy, or they can ignore important bits of literature that should not have been ignored, but it would be extraordinary for a academic paper simply aspire to pull the wool over your eyes. Alas, this is not true for some other kinds of papers --- especially those that hope to sell you newsletters, software, or --- believe it or not --- actual get rich quick schemes. Still, sometimes there is a paper that is neither fish nor foul. I've started a page to help you through this muddled middle ground. It is based on an concrete example provided by classmate Manny Singh, but I will not link to the paper. Google will still find it for you if you insist.
Sidebar: How to Pick Your Parameters
Anyone who thinks about any kind of quantitative strategy will face the problem of picking parameters --- smoothing parameters, number of lags, holding periods, etc. If you work in on a quantitative team you will be expected (1) to make wise choices and (2) explain why your choices were wise. I'm starting a page on this theme, and we will surely revisit it at least a few times. Please help me add to it. This is one of the biggest services that we can provide to our friends.
Day 22: Bet Sizing and Rates of Return
A topic that is dear to my heart and which is closely related to UPT is the Kelly-Breiman approach to bet sizing. We'll take a look at the resource page, including Samuelson's monosyllabic critique. Of course, when a famous guy says anything, it creates a literature --- and sometimes the literature provides and honest enrichment of the original theme. Personally I think Samuelson was wrong on several counts, some of which can be recovered from the Prekoz piece that I mentioned earlier.
- Generic Advice about Project Design
- This is a graduate course with widely a heterogeneous group of participants, so you have almost unbridled attitude for your final project. Still, to help calibrate yourself you should read the Final Project Spec Sheet for Stat 434. Almost everyone will want to go a beyond what this undergraduate course expects, and certainly no one should aspire to less.
- Still, in my experience, the way to make progress is to start with a reasonably modest target, hit that target, and build on concrete insights for real work. In the past, the projects that were genuine flops were those that started off with a complicated theme or with complicated data collection. They then foundered because of still further unexpected complications, lack of confirmation of the original hunch, too little time to do too much work, etc.
Back to Business: A VIX Strategy. We'll take a brief look at a piece from Credit Suisse on the VIX as a timing tool. It's not a particularly sustained analysis, but it is suggestive and it fits with one of the mini-presentations that we heard.
What's on Deck? We have five more classes, and two of these will be primarily reserved for your final project presentations. One of our tasks is In the other three days, we'll add to our stock of special asset classes ---especially those like MLPs where special strategies may apply. We also should pay some attention to the important conversation about the "equity premium." This is a big picture conversation that is a the heart of the investment process, yet even before the sobering year of 2008 it was surprisingly tricky. Maybe 2008 explains what was going on after all.
Finally, we have some summing up. We need to complete our reserve of stylized facts, and look at the design elements of a quantitative investigation of an investment strategy. I'll also try to tie a ribbon around the "theories" that we have kicked around: counter party theory, "special" asset theory, momentum (of multiple flavors), etc. We'll work up the complete list and work to sort out just what is the news you can use.
Day 21: Testing "Tech" and Framing UPT
We'll continue with our discussion of what has been called "technical analysis" --- which is a horrible term which can cause honorable "quantitative analysis" to get mixed up with some pretty raw hucksters.
In particular, we'll take a look at some of the analyses in the classic text: Colby and Meyer's Encyclopedia of Technical Analysis. The book is old, and the authors have the bad luck of sharing their names with a personal injury law firm. Still, we can't hold these two things against them, especially when they have a nice EDA method for seeing if a technical indicator is sensible or not. We'll look at the indicators that they tested and the results that they found. I'll shortly post some of their results as a PDF, but we'll start with a (very DOS-ish) hand-out. We're not done with "technical analytics" --- actually most of what Colby and Meyers is honest "quantitative analysis" --- but we'll open the conversation of universal portfolio theory (UPT).
In particular we will look at the ideas of Tom Cover's 1991 paper Universal Portfolio Theory. This paper was published on page 1 volume 1 of the of Mathematical Finance. It is the best known of Tom's finance papers, and it created quite a stir for a while. Things have calmed down now, but it still has a following --- especially in the IEEE literature.
Sidebar: Safety at Work (Just for Fun)
A work colleague passed along to me some example of work safety issues. This is not something that professors or people in the financial services industry traditionally concern themselves about. Still, it is useful just to see how lucky we are.
Day 20: Loops Closing and Opening
We'll close a number of loops. First we will complete the mini-project reports. Then we will look again at pairs trading. We have a technical issue that will call on us to be more formal about what we mean by a stationary series; this is not as easy as it seems and there is a big divergence between theory and practice. So, we need to contemplate tests for stationarity --- and hence for co-integration. We'll then look at the logic of pairs trading. As I note in an earlier sidebar, this is a little fishy. It is a good practice to ask "if this is fishy" and "if the story sold well" what was going on in people's minds?
We'll then look at some ideas of "technical analysis". Actually there is surprisingly little "technology" in mix. The most generous treatment is that given by Andy Lo, especially in his book "The Heretics of Finance." We'll dig a little deeper into this on subsequent days, but this will get the conversation rolling.
The other "project" that is on deck is the conversation about "universal portfolio theory." This requires the notion of the long-term rate of return. It's an easy number to contemplate, but one that is fraught with philosophical hazards.
Sidebar: More on Semi-Alternative Investments
What are the investments that one can make that have the character of the "alternative investments" that are made by institutions? There are a couple of classes of appeal, but they all circle around the idea that one has money to invest and thinks that an index portfolio of stocks and bonds can't be "right." Here are some examples.
- Fixed Income Yield Curve "Arbitrage" --- Annaly Capital Management
- Direct Infrastructure Investments --- MLPs of many kinds, but especially pipelines.
- Private Equity --- Conglomerates (Tyco, Leucadia, Illinois Tool Works, --- even GE)
- TIPS --- we'll hardly just for institutions, but definitely an asset class with a character of its own
- Long/Short US Government Debt. This is weird and temporary, but worth a discussion.
- Non-Examples. Commodity strategy ETFs, especially the GSCI based funds. Asymptotically, these have to have real return equal to zero.
Sidebar: More on the Logic of Pairs Trading
There is something psychologically attractive to the idea of pairs trades, but there is also something that is naive. Focusing explicitly on pairs can distract one from the basic facts; you have a short portfolio and a long portfolio. It doesn't matter how you constructed them; it matters how they do.
Still, there are some situations where pairing things up is what you have to do. For example, suppose you have a set of Agents and a set of Businesses. There is an allocation to be made. We may look a some classic mathematics for this problem, but I confess this is more for "intellectual stimulation" than for cheese. Still, school only last for a fraction of ones time on the planet. There are endless opportunities to be practical, and not nearly so many to just follow one's imagination.
Sidebar: Even-handed, Boring, or Insane?
In academia, we are constrained to be even-handed in the sense of providing --- and abiding by --- a balanced review of all the relevant literature. We also cannot overstep the bounds of our evidence, and our evidence is often modest. Sadly, simply by sticking with these two honest virtues, academicians have a hard time not being --- well --- boring. Still, being boring is not a terrible offense; even golf buddies sometimes find each other boring.
Still, once in a while you'll see an academic paper that steps over the line to become virtually insane. If you have a spare moment, check out this baby.
Day 19: Finishing Mini-Projects --- Opening Sidebars
We have some further mini-project reports to cover and given the "second mover advantage" we can count on them to be first rate. We may even see hits of cheese. As time permits, we will cover some sidebars, and perhaps --- at least in part for amusement --- prove a theorem about matching. To my knowledge there is no direct application of our particular problem to trading, but matching algorithms (I am told) are now used in various electronic routing systems.
Sidebar: The GM Splash --- Any Predictable Consequences
We don't have to be able to predict everything, we just need once in a while to predict something. We don't even have to have any extremely high probability prediction, just a good bet with a decent level of comfort that we have the sign right. Now, how about those GM exchange traded "baby bonds" --- most of which may be in the hands of GM employees, but which now trade at about $3.00 for a $25.00 face --- that is, 12% on the dollar. They were down 20% at 10am today... but don't you think you might get more than $3.00 out of the bankruptcy. (BGM)
This conversation feeds into the counter party theory --- and the hurdle rate of the counter-party. There are plenty of distressed debt experts and firms, but they have a bounded amount of capital and a bounded amount of time and talent for due diligence. There is no reason that big chunks cannot be left on the table. Still, everyone has to say at what level a bet becomes attractive. In the current environment, there are plenty of people who will say "don't even mention it unless you think it is a candidate to double."
Here, you also have to look at the alternatives. A bankrupt GM sends out lots of ripples, not all of which are bad. The trade creditors may take a haircut, or they may be made whole by the US Government.
Note: Mini-Project are Due March 23
On Wednesday you should be prepared to give the class a 5 to 10 minute summary of your mini-project. Be sure to set up your analysis carefully --- telling us the nature of your data and your original thesis. You can then go into the details of your investigation. We're always interested in "cheese" (our informal alpha), but be sure that you have thought through the risk consideration and the transaction costs --- though you can use our heuristic for this.
Day 18: Mini-Projects and Some Sidebars
Out main task is to engage the mini-projects. I am counting on everyone's participation in this discussion. Also, we will use what we find from our discussion of the miniproject to help frame possible themes, designs, and goals for the main project.
To the extent that we have additional time we'll dig a little deeper into Lo's essay "Where Do Alpha's Come From?". We may also open the conversation about what Samuelson called the Fallacy of Large Numbers. This really is a basic issue in the understanding of investment strategies, and it is easy enough to get confused about one side of the story or another. Some of the literature is summarized in a nice 2002 piece from Risk and Insurance.
Day 17: Zinkevich's Algorithm and Best Fixed Allocation
We look at a paradoxical algorithm that permits an on-line learner to do asymptotically as well as any fixed asset allocation. This may or may not be "practical" but it is curious, and it may be very practical --- we'll see. Our discussion will be based on a teaching note of Adam Kalai. We'll stick with one-dimension in class, but from the note you'll see that you can deal with a portfolio with any number of assets.
We'll then take a look at two academic papers that address "pairs trading." The first of these exhibits a replicable strategy that hold the prospect of cheese --- but it does have some troublesome features. The second tries to build a model of a return process where one would have excess return to pairs trading. This paper also leads to a discussion of whether we should or should not be skeptical of models that do not conform to the stylized facts that we know and love.
On Deck: We will shortly take a look at Andy Lo's 2007 paper, "Where Do Alpha's Come From?". We may take a quick look today, and you may want to give it a detailed reading for inclusion in our discussion on Wednesday. The main idea of the paper is that it may be possible to get insight into a managers performance by decomposing his returns into the contributions of his "active" and "passive" bets. This is Lo's AP decomposition. It's new, and it may or may not "work". Still, it offers a thoughtful approach to a very important problem.
Day 16: Experts and On-Line Learning
The main task will be to introduce one of the tricks from machine learning --- the on-line expert problem. One can go back and forth on the view that it tells us something that can lead to cheese. The discussion is based on the first half of the survey by Blum.
We'll then attend to some of the more recent sidebars, discuss your mini-projects that are due March 23. Also, we'll begin the discussion about your final projects, for which you will be making project presentations on April 20th, 22nd, and 27th. The sidebars are good places to look for final projects, and you may want to review some of the older ones. Also, those of you with expertise in machine learning will surely want to see what ML can tell us about asset returns, portfolio construction, or trade searching.
Sidebar: Application of a Negative Beta Asset
It mostly happens that the VIX and the SPY move in opposite directions, even though the VIX is in principle almost agnostic to the direction of the move --- only attentive to the size. Still, we know that the leverage effect is real, even if misnamed, so we have some nice non-linear elements coming into play here. The simplest way one might hope to make cheese out of these observations is to consider a portfolio of the SPY and VIX driven ETFs, say VXX or VXZ. I was tipped by a friend that there has been some discussion of this at a blog called Riptrade. [Thanks to Li Yi for finding this discussion --- which I did not find at first.]
Sidebar: Zero Beta Stock?
Wesco Financial is an extremely strange holding company for Kansas Banker's Insurance, CORT Furniture Rental, and Precision Steel (steele warehousing), and a good glob of California real estate. This business is also 80% owned by Berkshire Hathaway and a big chunk of the remainder is owned personally by Charlie Munger, Buffett's older --- and even funnier --- side kick. In the tradition of Berkshire Hathaway, Wesco Financial never pays a dividend.
From our perspective, what is amusing about Wesco Financial is that is is a walking statistical anomalies that contradicts (check me!) most if not all of our favorite facts. In a way this is natural, since this is only a publicly traded stock "in name only."
Sidebar: Ex Ante Returns to "Piling On"
I'll put this in the pot for discussion. There are often discussions of a trade becoming crowded, like long GM bonds and short GM stock. The implication is that when a trade becomes well known then it is not as good as it was. The may be true in some ex post tautological way, but it may be false if you think about risk and the ex ante expected return. The heresy that I am preaching here is that "piling on" may be smarter than constantly scratching around for the new-new thing.
Sidebar: The Conglomerate Theory
Money managers have to rely on their own analysis and the distributed statements of managements. Analysts no longer get to have private head-to-heads with managements, and they often get inadequate questions they get to ask when groups of analysts meet with management.
Now imagine a world where if you have a portfolio of business assets and anytime you want you can ask the CEO whatever you want to ask him --- and if he does not give you appropriate answers, then you can replace him with someone who does. Don't you think you could make more money from such a portfolio than you could from a portfolio that is based on Sarbaines-Oxley vetted baloney?
So, conglomerates like Berkshire Hathaway, Loews, Leucadia, etc. would seem to have a natural advantage over pure "portfolio investors" --- and here is the paradox: The portfolio of "conglomerates" has underperfomed the market since the late sixties (check me!) and now the market discounts conglomerates compared to their components (the "better of dead than alive" feature). This was not the case back in the glory days of Harold Genene of ITT.
Sidebar: Annaly Capital as a Simi-Alternative Investment
Last class I mentioned Annaly Capital (NLY) as a poor man's way to participate in the "semi-alternative asset" of fixed income arbitrage --- or yield curve betting. You might like to look at their primer on leverage --- this is the page where they explain what they do. One nice feature of NLY is that it is structured as a REIT. To some extent this is just a lucky bit of tax management, but this choice may also help to alleviate some agency problems.
Day 15: Can Hedge Fund Returns be Replicated?
The main task is to undertake a detailed review of Hasanhodzic and Lo (2006) paper, Can Hedge Fund Returns Be Replicated?: The Linear Case. Here are some of the bullet points:
- One Motivation: The Pension Fund, Hedge Fund Culture Gap
- A Simple Hedge Fund: Lo's Capital Decimation Partners
- Great Performance! See Table 1 page 5, Table 2 page 6
- The Strategy? It's Simple and Logical
- Returns are natural for the "product" provided
- Example of a do-it-yourself Hedge fund
- A Clairvoyant Firm: Capital Modification Partners
- Perfect T-Bill/SP500 monthly timing: Sharpe 2.5
- See Return Summary: Table 3 Page 7
- CMP --- very nonlinear compared to SP500, even with a R^2 of 70%
- TASS Hedge Fund Data Base
- Monthly returns, "net of fees"
- 11 Styles of Funds (table 4 page 10)
- 5 Major Categories
- Understanding Sources of Return by Risk Factor
- Six Linear Factors (stock mkt, bond mkt, currency basket, commodity basket, credit spread, volatility) --- almost all cheaply tradable.
- Factor Details page 10.
- Fitting the Fund returns to the Six Factors
- Modest Critique of the Hedge Fund Variance calculation
- Explaining the returns with Fees and other factors --- amusing, page 16.
- Table 7, page 17, little confusing, but amusing...
- Linear Clones
- Replication Method: Drop Alpha, Constrain Betas to sum to one.
- H and L variability renormalization (p. 21). I don't really care for this; why not just fall back on Sharpe ratios to make the comparisons "fair" --- we can debate this.
- The "roll ahead" implementation
- TABLE 9, page 25.
- One bottom line: Clones do almost as well as funds in most categories. They meaningfully under perform the emerging market or event driven fund categories.
- Other Goodies? Is monthly rho a measure of liquidity risk? How to honestly accommodate leverage? Equal weight portfolios?
Day 14: Innovations, Buy-Rights, Dividend Capture, etc.
- Three Plus Gambling Stories --- with Financial Punch lines
- The NJ Pick Three Lottery --- First Years
- The NJ 4 Coin Jackpot Slots --- First Years
- The Keno Chi-Square Story
- Hold em Trick at Party Poker in 2007
- Buy-Right Strategies
- Dividend Capture Strategies (Vanilla)
- Dividend Capture Strategies (CP)
- Non-Linearity --- The Diffuse Hope
- Non-Linearity --- via Indicators or Voting
- Signs: A Non-Linear Response Variable
- More on Features of Merit and the Mini-Project
- As Time Permits: Comments on Vile Practices
Sidebar: JSN, Not Crazy?
This Nuveen fund is a managed distribution fund built on a "historically conservative" option strategy. It is 75% in SP500 index portfolio and 25% in NASDQ index portfolio, AND it sells call options on the whole portfolio. The explicit option strategy is not disclosed in the annual report --- but the logical guess based on the construction of the BSX index that motivates the fund is that the option contracts are more-or-less: near-by, out-of-the-money, one-month options that are held for cash settlement. Traditionally, this is what one does to maximize liquidity and minimize transaction costs. The annual report does give the holdings as of the end of the year, and they seem to fit this picture.
Right now (2pm 3/3/09) JSN trades at a 20% discount to the NAV. Since we have no "management risk" (approximately) and since the expense ratio is a non-larcenous 66pb, and since there is historical data (hah!) that Buy-Right "out performs on a risk adjusted basis", this looks sweet. Obviously JSN did out perform in 2008 --- as it must have done in the absence of serious implementation flaws.
Given all this, I am embarrassed to say that JSN seems attractive, if not an out-and-out arbitrage. The distribution rate is 12%, but who cares about that? We'll, if it gets too goofy, it can be cut and that can lead to a widening of the discount as the share get dumped. That is an event, but it is not 100% clear if it changes your "economic interest."
Do you have a view that you can back up with analysis? JSN is definitely a goofy, non-professional asset --- so anything can happen. Still, the volume and bid/ask spreads are not so bad. Also, the market maker (or makers) seem to pay attention, unlike SVE.
Sidebar: EMH, Hedge Funds, and Iceland
You really should read Michael Lewis's piece on the Iceland run-up and blow-up. It is beautifully written and very funny. Ex post we are all geniuses, but how was this not clear as a bell ex ante? Full disclosure: I looked with some curiosity at various USD Icelandic Bonds in 2006. Happy I dodged that bullet!
Day 13: Change,Copulas and Correlation
- The Trust Preferred Game --- Big Win on Friday
- Buffett on "Historical Models"
- "What's Changed 'Theory'"
- Agency Problems and CDSs
- Buffett on the 1975 NYC crisis
- Buffett on Long term Puts and Black-Scholes
- Copulas and Correlation
- David Li's Default Correlation Model
Sidebar on Dyslexia and COPULAs
I am perfectly capable of misspelling almost anything, so I use my spell checker frequently. Still, the humble spell checker will miss out on some technical terms. Earlier I misspelled COPULA. Please correct me when I goof, or else my error will sit there on the web for decades. Incidentally, the venerable Wiki has a good piece on copulas that goes much further than we went in class --- indeed it may go too far.
Sidebar: Buffett on Investment Models
In Warren Buffett's 2/27/09 Letter to Shareholders, he had some well-chosen words for "history-based" models. We've met the issue in our discussion of the time series notion of non-stationarity and the economists Peso Problem, but as I read his comments, it seems there he is really coming more from the perspective of "what has changed principle."
"The stupefying losses in mortgage-related securities came in large part because of flawed, history-based models used by salesmen, rating agencies and investors. These parties looked at loss experience over periods when home prices rose only moderately and speculation in houses was negligible.
"They then made this experience a yardstick for evaluating future losses. They blissfully ignored the fact that house prices had recently skyrocketed, loan practices had deteriorated and many buyers had opted for houses they couldn't afford. In short, universe 'past' and universe 'current' had very different characteristics. But lenders, government and media largely failed to recognize this all-important fact.
"Investors should be skeptical of history-based models. Constructed by a nerdy-sounding priesthood using esoteric terms such as beta, gamma, sigma and the like, these models tend to look impressive. Too often, though, investors forget to examine the assumptions behind the symbols. Our advice: Beware of geeks bearing formulas."
Sidebar: What Else Did Buffett Say?
On pages 12 and 13 he discusses the municipal bond insurance business. After bragging a bit about BH's position compared to the other monoline insurers, he then comes up with a very clever "principle agent" argument. The essence of the argument is that in the 1975 NYC crisis there were many steps that were taken to repair the cities finances that would have probably not have been taken if the bonds had been insured. This is a striking piece of analysis with a game-theoretic flavor to it.
Later in the letter Buffett devotes a couple of pages to his view that for a long term (e.g. 100 year) put option the Black-Scholes value does not represent an economically sensible price. He frames his argument around the worst case scenario and the time value of money. Certainly it makes sense from a man-in-the street perspective, and it may even have new twist on arbitrage to it. We'll see.
Funniest Line? "If merely looking up past financial data would tell you what the future holds, the Forbes 400 would consist of librarians."
Sidebar: Modeling Correlation of Discrete Events
Everybody knows that many significant financial events are correlated --- or more broadly, "hooked up in some fashion or another". In fact, one of the mantras that came out of the collapse of LTCM was Lowenstein's phrase "In the extremes, everything is correlated."
Class colleague Manny Singh has pointed out a nice piece on this theme in WIRED Magazine "The formula that killed Wall Street." The formula in question is due to David Li, and we'll take a brief look at Riskmetric's copy of Li's 2000 paper that first presented the formula in question. We won't close the loop on the applications to CDSs, but we will answer three basic questions: (a) What is a copula? (b) What problem does a copula solve? and (c) What makes it risky business?
Sidebar: Trust Preferred Home Run!
The soup is still boiling, but so far it looks good for the home team. From the WSJ on 2/27:"The company will continue to pay the distribution on its Trust Preferred Securities and Enhanced Trust Preferred Securities at the current rates."
Follow-up (2/28/09) : Essentially all of the Citi Trust Preferreds were up about 20% on Friday the 27th. The common dropped almost 50%, so the long-trust preferred, short common trade was a monster.
Follow-up (3/10/09): Yesterday the banks rallied big time with the common out doing the trust preferred. Today, the trust preferreds are doing better than the common, so despite a scary move, the trust preferred the trade is still working. Tempting to unhedge: cover (some of?) the common and keep the preferred.
Sidebar: M and A --- Risk Arbitrage and Equilibrium
There are many sites (including the WSJ) that give you a list of the current merger and acquisition deals and the spread between the current market price and the tender offer. We'll take a brief look at the list at Pending Mergers . It is pretty clear that a chunk of these deals are expected to fall apart, but it will not always be that way (one hopes).
I haven't hunted down the offering documents for any of these, but some may have an odd-lot preference. Using such a list is a superior way to find find such deals; the Google alerts tend to turn up too many foreign and fixed income tender offers.
Sidebar: TARP in Pictures
I am a sucker for hand-outs and notoriously short-sighted about things like moral hazard, so I tend to greet each new stage of government largess with a sense of optimism. Still, the critics do have their points, and there is sequence of stills that makes their point quite well.
Day 12: Preferred Shares: Facts and Strategies
- Discussion of Incoming Homework on CEFs
- Another Weird Asset Class: Preferred Shares
- Historical Stylized Facts of Preferred Shares
- The Classical Downside
- Detour: Duration Extension, an Old ML Blunder
- Types of Preferred Shares
- KeyCorp Trust Preferred Prospectus
- The Trust vs non-Trust Pairs Trade
- More Examples of the "Counter Party Theory"
- First Mini Project
Sidebar: Structure of a Preferred Trust
For more details on the legal structure that is used to bring a trust preferred to life, you may want to look at the prospectus for the KeyCorp Capital IX 6.75% Enhanced Trust Preferred Securities. It is 87 pages long, but you can get a lot out of just looking at the diagram on page 7.
Sidebar: All the Preferred Share Prospectuses
QuantumOnline gives you easy well-indexed access the prospectuses for all of the existing preferred shares. Registration is required but it is free. Their business plan is not too complicated: after a while they put a little "frowny face" next to your login if you chose not to make a voluntary contribution. If the opprobrium of the frowny fact is too much to bear you can also get these directly from the SEC.
Sidebar: Preferreds --- Vanilla vs Trust "Pair Trade"
Preferred shares come in two basic flavors. The vanilla preferreds are typically (1) perpetual (2) have non-cumulative dividends --- so an omitted dividend is gone forever, and (3) pay qualified dividends (out of after-tax earnings). The trust preferreds are typically (1) of bounded --- but long --- maturity, (2) cumulative, but with provisions for deferment of payment for up to five years, and (3) pay non-qualified dividends out of pre-tax funds --- much like a bond.
Trust Preferred shares are the archetype of a hybrid security and they have a curious legal structure. Also, in these TARP days of winter, it is nice that their status as debt means that they come in higher in the capital structure than the government owned preferreds, but please do check this point --- my grasp of corporate governance and the capital structure is getting weaker by the day.
Now what has happened over the last little while is that the vanilla preferred and the trust preferreds have been slaughtered indiscriminately. Still, isn't the trust preferred actually in a pretty sweet position? Going forward, wouldn't it make sense to be long the trust preferred and short the vanilla preferred? Or, if the vanilla preferred are hard to short (or non-existent), you can pair the trust preferred with the common.
Now, if your bank gets brutalized like FNM and FRE, the vanilla preferred will go to epsilon, but the trust preferred "should" be in line ahead of the government's preferreds, and you "should" make a fortune. Still, anyone who is interested in this idea will want to study hard what just happened to FNM. As for candidates C, BAC, WFC and other still-breathing TARP recipients have oodles of trust shares.
Day 11: Special Lecture by Jonathan Reiss
Jonathan Reiss is CEO of Analytical Synthesis, a firm he founded after a long career at Sanford C. Bernstein (now AllianceBernstein) and were he held many positions including Director of Fixed Income Research. As an introduction, to Jonathan's way of thinking, you can take a look at his 2006 Barron's article, Hedging Your Hedge Fund Bet. Still, times change his lecture this year is sure to be on a variety of new topics. Be sure to bring your questions about market innovations and current developments!
Sidebar: CEF Daily NAVs from Yahoo!
Classmate Mit Shah has found that at least some daily NAVs for CEFs are available from Yahoo! Here is his trick: Prepend and append ‘X’ to the ticker symbol in the URL for historical price data. This will give you the URL for the NAV data. You can then move this to Excel and then to S-Plus.
For example, after the usual interaction with Yahoo! you can get the URL for 10-yr historical price data for IIF (Morgan Stanley’s India Investment Fund):
http://finance.yahoo.com/q/hp?s=IIF&a=01&b=21&c=1999&d=01&e=21&cf=2009&g=d
Now the URL that fetches historical daily NAV data (verified against last NAV at Morningstar) is given by
http://finance.yahoo.com/q/hp?s=XIIFX&a=01&b=21&c=1999&d=01&e=21&f=2009&g=d
Some cautions: For returns, you'll have to get dividends and the ex-dividend days. This may not be bad for country funds which may only pay annual dividends, but it would be a pain with the managed distribution funds --- unless you are an internet wizard. We should also do some independent checking that this really gives us the NAV. So far there is just the confirmation against one day's NAV at Morningstar. Mat will have to tell us the story by which he came to this trick.
Sidebar: Two Quotes from David Swensen 2/18/09
On Endowment Strategies : "The right solution is at one extreme or the other. One end of the spectrum is being intensively active. The other is being completely passive. If you end up in the middle, which is where almost everybody is, you pay way too much in fees and end up getting subpar returns."
On Current Valuations : "I'd say U.S. Treasuries are incredibly unattractive. That's not hard. Pretty much everything else is very attractive. Distressed credit is a pretty obvious opportunity. The dysfunction in the credit markets is creating some extraordinary opportunities right now."
From the interview 2/18/09 in Propublica.
Day 10. CEF Stylized Facts, Alpha, and CPT
- Utility Theory and the Tautological CAPM
- Looking Back at the Argument: FF? Cash vs Mkt? Zero?
- Counter Party "Theory" and Financial Engineering
- What's Changed "Theory"
- Example: Gold ETFs and "Oversupply" of Long-Only Speculators
- CEF Stylized Time Series Facts
Getting NAVs for CEFs from WRDS
Here is what I know so far ... look for more later and if you find the path to daily NAVs let me know.
Day 9. More on Momentum (and Crazy CEFs)
- A look at the sidebar on changing momentum
- Cooper et. al. and moment changes depending on past returns
- "Risk Adjusted Returns" --- via CAPM or Fama-French
- Alpha is a meaningful measure, but is it really "risk adjustment"?
- Time series regressions --- some are insanely spurious
- Discussion of the Nutty Nuveen Homework (open loop)
- More CEFs that may be anomalous
- Some Bread and Butter CEF stylistic facts
- Predictability of CEF discounts (Malkiel and Xu)
Sidebar: A Measure of Changing Momentum
This is a graph of 5-year rolling average of next-day returns following an down day (red) and a up day (blue).
The observation made by MarketSci Blog is that "for most of the last 60 years, the market has exhibited at least some degree of follow-through; up days tended to follow up days and vice-versa; however, since the mid-1970’s, this difference has been eroding, and since the new millennium, has actually flipped to contrarian; up days now tend to be followed by down days and vice-versa."
Day 8. Two Modeling Puzzles: Rebalancing and CEFs
- Warm-up with the sidebars (and accelerated return notes)
- The Rebalancing Story --- What Model Goes Under It?
- Diffusions, Subdiffusions, and Superdiffusions
- Counterparty theory and its application to closed-end funds
- CEFs in general
- Leveraged Bond Funds (a derivative sold to people who never dreamed of buying a derivative)
- The Managed Distribution CEFs --- a Criminal Asset Class
- Nuveen Funds --- any way to turn the tables?
- Time Series Anomalies in CEFs --- the New Homework
- Alpine and the dividend capture strategy
Sidebar: For Later Consideration
- Dominatated Assets and market efficiency
- CEOs, Boards, and the Paradox of "Profit Sharing" (This is related to "Equity Premium Puzzle")
- Large Country/Small Country Story
Sidebar: University Endowments
David F. Swensen and Jack R. Meyer managed the endowments of Yale and Harvard, respectively. Here are their allocations circa October 2005 which may seem like ancient history, or which may be close to steady state --- we'll see.
| Harvard | Yale | |
|---|---|---|
| Domestic Equity | 15% | 14% |
| Foreign Equity | 15% | 14% |
| Private Equity | 13% | 17% |
| Fixed Income (bonds) | 27% | 5% |
| Real Assets | 23% | 25% |
| Absolute Return (hedge funds) | 12% | 25% |
I have a somewhat dated page on University Endowment investments, but now Google can up-date it faster than I can, so I trust that you can discover if there have been some weird U-turns in the history of university investment policies.
Swensen on Rebalancing
"Net profits from rebalancing amounted to approximately $26 million, representing a 1.6 percent incremental annual return on the $1.6 billion domestic equity portfolio." D.S. in Unconventional Success p. 198.
Based on my own positive experiences playing around with rebalancing, I met this sentence with a eager dollop of confirmation bias. Now, I start to worry --- what does it really mean, how was it calculated, and --- isn't there an attendant risk of some flavor?
Accelerated Return Notes
You might enjoy looking at prospectus of the ETN that I mentioned today in class --- it trades under the symbol DVK, offers "accelerated return" on the Dow-Jones Index (pure index, not total return). It matures May 6, 2009 and the "index base" was 12, 694.28 so the current "intrinsic value" is $6.39 at the close on 2/9/09. On the other hand, it's closing price was $6.19.
The 3.2% spread is your time value for about 90 days, call it a 12.9% "yield" (more if you have a positive "mu" for the market, and a bit less if you think the Kingdom of Sweden is not good for the dough). Volume today was 2400 (only about $15K) and was a good day --- there have been days when volume was zero. The bid-ask spread has been as big as 30 cents.
Another note to look at is SVE. This has all of the amusements of DVK (orphaned from any sponsorship, low volume, weird bid-ask behavior, etc.) and you get the extra "benefit" of credit risk via Citigroup--- "The Notes will rank equally with all other unsecured and unsubordinated debt of Citigroup Funding " but look at that guarantee on page one of the prospectus where it says --- "unconditionally guaranteed by Citigroup" --- that sounds even better than "senior unsubordinated" to me, but you'd need the opinion of a (good!) bond lawyer to really know.
Day 7. Strategies and Momentum
- First: HW Report on Leverage Effect
- Momentum Studies
- Moskowitz and Grinblatt 99
- Arrowsmith
- Hinker, et. al. 2006
- Issues of time scale --- What's the right experimental design?
Sidebar: Media Brilliance

"Way back in August of 1979, BusinessWeek ran one of its most famous cover stories ever on "The Death of Equities." The story is widely regarded as a brilliant contrary indicator. Shortly after it ran, the market began a twenty-year bull run." --- nice observation of John Carney.
Still, a question remains: Could we really get that lucky twice?
Sidebar: VIX Driven Trading Strategies
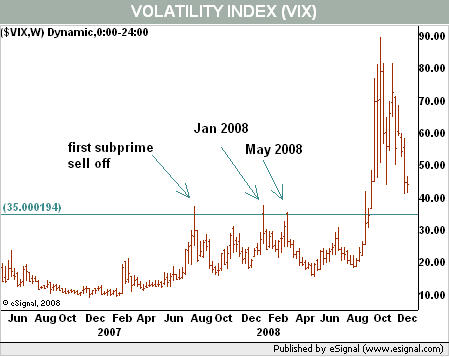
There are lots trading strategies that that queue off of the VIX, and, like strategies in general, some had a pretty good record --- until they didn't. You might be amused by the 12/24/08 Barron's piece --- though it looks like a plant from Larry Connors.
Headline: "UK interest Rate Lowest since 1694"
Nice headline for 2/5/09 but what does it mean? There is not a lot of honest benefit to sweating out the details, but I must admit that the headline amuses me.
Day 6. Stylistic Facts of Volatility.
- GARCH Resources
- Engle and Patton "What Good is a Volatility Model"
- Engle "GARCH 101" (VAR "ouch")
- Threshold GARCH (one of two TGARCH objects)
- NB: You can threshold anything, and this makes for some good ideas to explore.
- EGarch
- GARCH ZOO
- HW and the Sidebars
- Comments on Value at Risk
- HMM Algorithms (soon)
Quote of the Day
"Value at risk (V.A.R.) as a reliable measure of risk will hopefully be taken out and shot at dawn. "--- GMO Quarterly Letter Q3 2008.
Sidebar: VIX "returns" and SPY returns
This is a slightly weird regression with some "amateur" tells. It certainly needs to be replicated before it can be trusted. Still, it kicks off an interesting conversation. The general theme is "What is the relationship between volatility and returns?" This can be framed in many-many ways, some of which are non-sense, but some of which may be insightful.
Sidebar: Volume and Market Impact.
There is an interesting Barra piece that incorporates some of the stylized facts associated with volume. The official objective is to model market impact costs, but that part of the story does no seem super compelling. It is amusing that the piece uses GE (circa 1997) as its leading example. For us, the main point here is just a reminder that one can (should?) use volume as one of the inputs to our analysis. In particular, it would be nice to work out a good list of the stylized facts of volume. My bet is that you will often find significant MA terms in a plain-vanilla ARMA fit. Gallant, Rossi, and Tauchen (1990) do archive some observations; in particular, they report that large price moves tend to be followed by higher levels of volume. (see the Bollerslev Review)
Day 5. Stylized Facts, GARCH and HMMs
- Weird Asset: Stable Value Funds (for Amateurs Only)
- Stylized Fact List --- and a New Candidate
- From ARCH to GARCH (noise models)
- Continuing with HMMs (and the State Space Story)
- HMM in R? Yes, there is a nice package.
- Mathematical Background for the HMM Package (with some pretty confusing notation!)
- HMM Resource Page (especially Ryden et. al. and tutorials)
- Andrew Moore's tutorial on HMMs It starts a little slowly, but have faith. Soon enough, it lays out the "three basic tasks" quite clearly. Also, the notation used here is as good as it gets. I am always surprised when someone does something else.
Sidebar: 50DMA =/-2SD Graphics from Bespoke IG
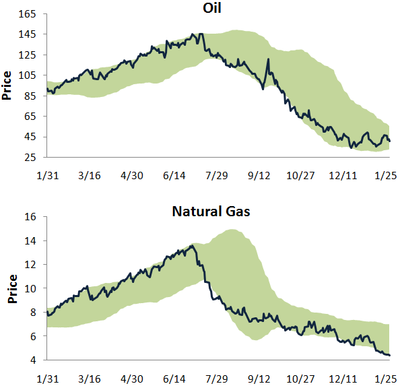
Future returns will surely vary (and most likely vary in the way we find most damnably confusing), but I find some thing intriguing (and perhaps instructive) in these nice 20082009 pictures from Bespoke Investment Group.
First, just to explain the graphic, the green area is supposed to be obtained by taking the simple 50 day moving average and painting in green the values within plus or minus of 2 simple 50 day trailing standard deviations about the mean. The pictures don't seem to me like they really follow that rule (skeptic that I am), but let's take the authors at their word until we draw our own.
Traditionalists (and BIG) suggest that "Moves above or below the trading range are considered overbought or oversold" but this is not what strikes me about these graphs. What intrigues me is that the price so narrowly hugs the extremes of the green "trading range".
Is there a stylistic fact here? Or, perhaps, are we just hypnotized --- as we so often are when we look at prices instead of returns?
By the way, there is a beautiful fact in probability theory that makes this "almost all ways at one extreme or another" quite a feasible phenomenon. The arcsin law is one of the theoretical facts that shows why even the fairest world can seem unfair to a casual observer
Sidebar: Stable Value Funds
One product that gets a warmer reception during bear markets is the "stable value fund." This is an engineered product that guarantees the purchaser a certain return (say 3%) as well as some of the up-side of some market (say 50% of any increase in the SP500 index). These assets come with a big lock-up period, and fees at every turn. Always the purchaser pays way too much for the warrantee, but its got a good pitch --- and as an insurance product it needs one. Nevertheless, someplace, perhaps on some far distant planet, they may deserve consideration, but to me it mostly it looks like a $150B pile of dumb money. For balance, you can read the association pitch.
Day 4. HMM, ARMA, and Peak at ARCH
- The hidden Markov model in general
- Review of MLEs
- Most Classic Example
- Likelihood and HMM
- A Computational Complexity Puzzle
- ARMA in general
- Next Stylistic Fact --- Predictable Squared Returns
- First way out of the trap --- ARCH
- Tools: S-Plus on the Way ... Little HW break
Contested Quote of the Day
"We have one-hundredth as many farmers as we had at the turn of the 20th century. We now 500 times more grain." --- Denis Gartman, 1/24/09.
The implied factor of increased productivity of 50,000 per farmer hardly seems believable, even though experience with microprocessors has inoculated us to such fantastic possibilities. Actually, a little checking shows that Gartman was playing a bit too fast and loose. In 1900 about one half of all workers were farmers. In 2000 about 2% of workers were farmers. Since the population tripled, this means there were about 8 times as many farmers in 1900 as we have today --- not a 100. Thomas Plank also looked into the productivity side. For potatoes, it seems that the productivity gain per acre is about 600%. There is still some mystery about how we turn this to productivity per farmer, but, at a minimum, we know we need to apply a massive discount factor to Gartman's estimate.
Day 3. Stationarity --- Intuition and Analytics
- Recalling the AR(1) representing
- The Story about Unconditional Variance
- Mean-Variance Stationarity
- Theta Notation and Stationarity in AR(p)
- Stationarity and Commodity ETFs
- More on Markov Chains
- The Hidden Markov Model (and Hidden History)
- Animal Spirits. “Treasuries have some bubble characteristics, certainly the Treasury bill does.” --- Bill Gross, PIMCO co-CIO.
Sidebar: BigMac Index is Out
Forbes Agonize has a periodic feature that uses the USD price of the BigMac to get a handle on relative prices and exchange rates around the world. It's always worth a look.
Sidebar: Thoughtful Paper on the Current Financial Crisis
Reinhart and Rogoff have an informative paper that benchmarks the current financial crisis against past financial crises. It is well worth reading.
Sidebar: Fund Separation Theorem and Bonds
I started a little page on the implications of the separation theorem. In particular, it links to a nice paper that helps explain the connection between the austere implications of the theorems and more traditional investment advice.
Sidebar: SNL Broker Parody
It really is very funny, even if sad. BTW, it comes and goes depending on NBC's diligence in copyright enforcement, so if this link doesn't work just use Google (which does no harm) to find the currently active pirate.
Notes on R and Its Packages
I hope to post a piece on installing R packages shortly. Like all homebrew stuff, you pay in pain what you save in money. We do want to collect some R experience, but S-Pus Finmetrics is a more pleasing experience and I hope to make S-Plus available for you shortly.
Full disclosure: Today I seem to have messed up my own R installation big time, so "I know your pain."
Day 2. Returns, The Markov Property, and Stationarity
- Comment on Recommended Text and Math Requirements
- Your Results from HW1 --- the First Stylized Facts
- Details on Returns (Kinds and Kinks)
- Volatility Drag --- and a Paradox
- AR(1) and the Markov Property
- Conditional vs Unconditional Marginal Distribution
- Discrete Markov Chains (Back to the Future?)
- Wold Decomposition
Day 1. Returns, WRDS, First Facts and Models
- Mind Map for the Course
- Mathematical Requirements
- Commitment and Expectations
- Comments on Getting and Using R
- Data Sourcing (WRDS and CRSP)
- Assessing Normality --- JB Tests, etc.
- Model Zero: IID returns
- Model One: AR(p) returns
- Ljung-Box Test
- Homework No. 1 (Due Wed. Jan 21)
- Day One Questionnaire (Due Wed. Jan 21)
- Reasonable Wiki Sources (JB Test, Ljung-Box Test)
- One Source for Normal Test in R --- where is JB?
Is thiS A Course for you?
- Top Down. This course course should be useful for a wide range of students in finance, economics, and statistics. If you are interested in models for asset returns and if you are interested in the algorithms that drive widely used empirical estimation methods, then this course should be on your shopping list. Still, there is stuff you need to know to get value out of the course.
- Prerequisites. Students who have had one or more graduate level courses in statistics or econometrics should be well-prepared. The full range of linear algebra tools will be fair game. Similarly, students will be expected to know about maximum likelihood and Bayes's theorem. It is not expected that students have a background in numerical analysis, but a healthy curiosity about numerical methods will help.
- Expectations. The more advanced feature of this course is that (at least to some extent) students will engage reasonably current research papers. After we develop some fundamentals students should be ready to digest, summarize, and --- on occasion --- to go beyond current research work. I hope that at some students will find some issues here that they would like to pursue as research projects. These can be done in cooperation with other projects that may interest you.
Course Policies
- Housekeeping. Please no cell phones, no open lap tops, no newspapers, no hoagies, etc. A coffee or a soft drink is OK, but be mindful of your neighbor's space.
- Homework and Projects. There will be regular homework exercises, and there will be two mi co-projects plus a final project. The projects can be done in teams of size two. Latex will be needed for the micro-projects and for the final project.
- Grading. Homework will count for (10%) and there will be two micro projects (worth 20% each) and a final project ( worth 50%).
- Balance. The first micro project will cover basic skills and will be more like an early take-home mid-term. There is some flexibility in the second micro project and the final project. All of the homeworks and projects are recommended to be done in two person teams, but individuals who prefer to go it alone are welcome to do so. Teams larger than two are acceptable only under extreme circumstances.
- Auditing --- Certainly! You are most welcome. Still, we hope that you will contribute actively. Naturally, auditors are also expected to follow the usual housekeeping rules.
Course Topics
- As our baseline, will rely on Shumway and Stoffer Time Series Analysis and Its Applications (with R Examples) Second Edition, Springer 2006.
- You can get a rough idea of the style of Stat 956 by looking at the web page for the undergraduate course 434, but we will cover the material of 434 very quickly, and it will represent at most a fourth of our effort. There is a formal syllabus, but it drifts out of date.
- Stat 956 assumes that you have much more knowledge of statistical theory and statistical computing.
- To be sure, we will cover ARIMA and GARCH in some detail, and we will also look at the reformulations of the estimation algorithms in terms of the Kalman filtering algorithm.
- We will also discuss a variety of non-linear models including TAR, TGARCH, EGARCH, and other models in the GARCH zoo.
- This will lead us to explore the function optimization tools that are used in S-plus and R, so we will get to take a look at some "classical" optimization methods --- and their implementations.
- A favorite topic will be the Hidden Markov model. It's structure underlies the logic of many many process --- recognized and unrecognized.
- We'll also look hard at some of the ways that time series methods can inform investment decisions. To start off the list,we'll take a hard look at Style Rotation.
- We'll do a bit with the approximation of continuous time models. Here we mainly want to understand the gap between these and the discrete time analogs. This may lead to some discussion of numerical tools for pricing contingent claims.
- Finally, if time and interest permit, we will discuss competitive algorithms and evolutionary learning algorithms --- two "hot topics."