A statistics course
committed to honest data analysis,
focused on mastery of best-practice models,
and obsessed with the dynamics of financial markets
Course Blog
Archive: Course Blog for Fall 2007
What you find below is the blog for Stat 434 Financial Time Series Fall 2007.
I'll leave this bog up for a while so former students can have access to the resources and prospective students can have a idea of what our class is like. Like all one-page blogs, this one reads in reverse chronological order. If you're new to the page, you'll do best to start at the bottom and scroll up. To be sure the class changes from year to year, but there is still substantial continuity.
![]()
Projects Due --- Noon 12/12. Both Hard Copy and E-copy.
The projects are due on December 12, and this is early in the exam schedule. I need an electronic copy by email and a hard copy in my mail box by HIGH NOON.
Repeat: Hard Copy in Mail box, ECopy sent to me by email. High Noon December 12
Note on Zero-Cost Portfolios --- Up Date (12/7/07)
We discussed zero-cost portfolios briefly in class, but I want to make sure that you know how to compute the returns for such portfolios. If you don't short this out, you will run into some paradoxes when you compute your Sharpe ratios and other measures of risk adjusted returns. I have added more detail (and some corrections) to the earlier note.
So, please read the REVISED NOTE on Returns.
Congratulations! And Something Funny
The presentations are all complete, and, I must confess, you have knocked my socks off. These project proposal were all well prepared, and more than a few met a very impressive level of professionalism. As little respite from all your hard work, you might take a look at very funny and insightful piece from British TV on the CDO SIV crisis. It definitely belongs in the "sad but true" column.
Final Project Information --- Final Advice
You have already made serious progress on you projects, but you should periodically review the e-Handout on the final project process.
In the end, what separates a good project from less good project is the clarity of the theme that emerges. Some people have clear themes, a clear thought, and a clear beginning. This is a very good thing. Other people are still living in a cloud of possibilities. This need not be bad, but it needs work. By now you know that no one is impressed by a lot of buzz words and fuzzy thinking. The "news we can use" may be modest, but it must be clear. Sometimes life is complex, so your challenge is to extract what is clear from all the mess.
To give three pieces of advice: Be Clear, Be Clear, Be Clear.
Want a fourth piece? Above all be honest.
Little Big Man observed on this (not) death bed: "Sometimes the magic doesn't work."
This too is news we can use, if it is presented clearly.
Day 24: Putting the Pieces Together
For 28th November 2007
This completes two dozen lectures --- a very modest number for topics that occupy as much of the collective consciousness of mankind as do the many themes of financial time series.
Our plan for the day is to (1) review the stylized facts that we have verified from our own analyses --- and add a few new twists (2) review our models with a focus on where they add insight and value, and finally (3) look a ways these can inform the design of interesting projects.
I'll also add a word or two about the use of confidence intervals and suggest a new technique --- bootstrapping ---which you can use to get confidence intervals (of a sort) for the return on a trading strategy. The method is not perfect, but it definitely has its charms.
I'll also ring the bell again about the importance of data cleaning, EDA, and presentation with thoughtful tables and graphs. We'll also attend to any logistics of the proposal presentations that you will be giving on Dec 3 and Dec 5.
Generic Advice about Project Design (and Process Comments)
Certainly read the Final Project Spec Sheet. I'll review some of the main points in class. The one I would underscore here is that clear thinking is a key to having an excellent report. You want to make clear assertions and you want to make sure that what you assert is backed up by clear, thoughtful, and thorough research. Even a "simple" theme can lead to a very rich report if it is engaged carefully and completely.
Sidebar: Wikipedia on the VIX
The Wiki piece on the VIX is pretty good, maybe even very good. You might test how often the VIX really does correctly forecast the next month absolute change.You could think about this in concert with the little volatility paper by Goldstein and Taleb a look at their paper. Yahoo!, may the name usually be cursed, does offer nice VIX graphics. Still, what is the logic of the log scale here?
Sidebar: Disingenuous Vanguard Piece on Rotation
Vanguard is an organization with great integrity, but the folks there do have their foibles. Their piece for 11/27 is more naive that I believe the authors are. My guess is that they just fell victim to confirmation biases. What is wrong with the report is not so much what is there but what is missing.
Here is a hint: Much discussion focuses on mean returns, not the discussion of risk adjusted returns --- not even Sharpe ratios! They also stack the deck in other ways --- e.g. they use of lame forecasting rules, use only one strawman, and take no analysis of the cash alternative. This would not be a very good 434 project!
Sidebar: Dollar Weakness and Stock Market Returns?
About a month ago there was an instructive piece in Business Week on the relationship of the strength (or weakness) of the dollar to the returns on US equities. The article looks at changes (or returns), not levels, so it avoids a the classic spurious regression slip. The use of monthly data and the shortness of the series make it hard to put the article's inferences into the domain of stylized facts, but I would expect that there are observations here that will stand the tests of time.
Sidebar: Irrational Pessimism?
This is an amusing concept, together with its twin: "Pessimism Bubble" --- we'll discuss the metrics if we have time.
Day 23: Comparing Asset Returns in the Context of Risk
For 26th November 2007
The plan for today is to look at the notion of risk adjusted returns from soup to nuts. This is a very interesting topic in financial time series, and it has been developed far less systematically than one might have guessed. We'll consider all of the conventional measures, and add a few variations of our own. We'll also look at what one might learn about risks by consideration of post-mortem analyses of crises and crashes.
Sidebar: The Risks of Being in Charge of Risk Models
Things do have a way of periodically blowing up, and now banks have found the natural goat -- the guy in charge of the VaR models. (see story). Reminds me of some advice I once gave a class of Wharton undergrads...
Sidebar: Goldman Sachs and VaR
There is a CNN piece on the GS big win from its short position in mortgages. For us, the interesting comments are in the last third of the article where VaR is discussed.
Sidebar: Volatility? What Volatility Are You Talking About?
When I saw the title of the paper " We Don’t Quite Know What We Are Talking About When We Talk About Volatility" by Daniel G. Goldstein and Nassim Taleb, I was quite excited.
At last, I thought, someone is making the point in print that I have made repeatedly in class. Namely, each time we say "volatility" we point to some parameter in some model, but the model and the parameter can differ from utterance to utterance. This is silly of us, but we all do it.
Goldstein and Taleb get a whiff of this, but not the full scent by any means. Still, you should take a look at their paper. It is a quick read.
Sidebar: PDP a Momentum ETF
PDP is a PowerShare ETF launched in March 2007. The prospectus is one that would make Jessie James uneasy. Unfortunately this asset has not been around long enough to be amenable to much analysis, but the underlying theory of the asset is interesting. It is a momentum story based on a proprietary momentum index --- which would all seem insane --- except that the proprietary index is published independently of PowerShares. Still, the index provider does not seem hesitant to be a promoter of the ETF. Net-net, this does not look like a healthy development.
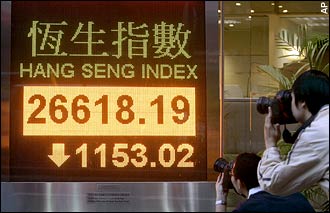
Sidebar: Where is the Decimal? General Note on HSI Volatility
Sidebar: Nice EDA --- Two Regions Each with Ten Sectors
If you take the 10 sectors of the SP500 and the 10 sectors of the MSCM EAFE you get 10 pairs of numbers, one for each sector. You can then plot these pairs in two dimensions and then ponder the meaning of the 45 degree line. Lo and Behold! It tells you in which of the two regions the given sector is now doing best.
This gives a very interesting snapshot of current market "stages." Note: Points that are near the line are doing about as well in each region, so not much "weight" should be placed on these points. Still, each one of these points deserves a story.
Sidebar: Stupid Forbes Article
There is a Forbes article exactly on today's topic, and it illustrates just how astoundingly shallow magazine articles can be. Here is one with shallowness that we can see so easily, it can cause us no harm. What scares me is not this article, but all the ones that I read and think that I have learned something new.
Sidebar: Black Rock Insane Bandit Fund (one of several)
The Black Rock Fund Equity Dividend Fund (class A) MDDVX , has a front end charge of 5.25% and a turnover ratio of 2%. If you like this asset, just check the SEC filling, get the holdings, and voi-la 98% replication. This is a dominated asset with 750M under management. They should be ashamed of themselves. Oh, by the way, they have 100bp expense ratio, and --- a Morningstar rating of 4 stars --- which pretty well tells you how worthless Morningstar ratings can be.
What a bizarre situation! Well, small turn over is a virtue of sorts, but why should one pay 100bp for the experience?

Day 22: A Thanksgiving Interlude
For 21th November 2007
This is is a special day where many people will have taken an early exit for family reasons. Those who can attend class this afternoon deserve to have a little fun. We have a regular plan with several honest and interesting (but supplemental) topics.
At the end, we'll do a kind of juggling that is not too common in academia --- except at MIT. We will also get to explore the elegant fact that "human talent is long tailed."
Naturally, we have e-Handouts, and I hope many of you bring Tennis (or other similar) balls.
We also have many nice sidebars to explore.
Sidebar: Sentimental Journey ---Where have all the MAs Gone?
We haven't discussed MA models very much because MA models are typically inappropriate to financial returns. Still, there can be exceptions --- perhaps lucrative ones. One possibility is the new weird ETF (symbol NFO)which aims to track the performance of the Insider Sentiment Index. (more about Sabrient)
What interests me about this is that "opinion" indices typically have a large MA component. Perhaps the sentimentality index is predictable. You'll have to do some research to find out what is really going on here, but it looks like an interesting project to me.
Sidebar: Wharton Undergraduate --- Salary Survey
You probably are all keenly aware of the WUG salary survey. The one I have is for 2004 --- still it is worth a look. It will help you estimate your human capital.
Sidebar: Fermi Calculations and Petro Dollars?
President Chavez of Venezuela has recently argued that OPEC should re-denominate oil prices in Euros rather than the USD. How feasible is this? Can a "Fermi calculation" help? Incidentally, re-denomination has been proposed by Qatar and is under study by Saudi Arabia, so the issue is in play.
Sidebar: Home ownership and a Civil Society
The level of home ownership in a country is a very useful indicator of the democratization of the country. The levels one observes today are not 100% intuitive, but that is almost surely because our intuition is wrong. Incidentally, one might search out the home ownership percentages for Taiwan. I recall it as being larger than any of the values in this table. A mild paradox?
Sidebar: FXC Canadian Dollar Trust
The ETF FXC has 280M USD capitalization, and aims to track the return to holding short term deposits in Canadian dollars. For this, they change 40bp. It is not clear for whom this is a natural investment, but it has a market capitalization of 280M USD, so some people must like it.
The trusts assets are of two kinds; some that provide interest, and some that don't. This is a piece of financial engineering. It is hard to understand just what risks and rewards are left for the customer. Ironically, it is not that hard to buy a term deposit in Canada and the bid-ask spreads on the exchange rate are modest
Sidebar: More from Schiller?
Here is a wonderful abstract for his paper From Efficient Market Theory to Behavioral Finance.
"The efficient markets theory reached the height of its dominance in academic circles around the 1970s. Faith in this theory was eroded by a succession of discoveries of anomalies, many in the 1980s, and of evidence of excess volatility of returns. Finance literature in this decade and after suggests a more nuanced view of the value of the efficient markets theory, and, starting in the 1990s, a blossoming of research on behavioral finance. Some important developments in the 1990s and recently include feedback theories, models of the interaction of smart money with ordinary investors, and evidence on obstacles to smart money."
Day 21: Cointegration and Statistical Arbitrage
For 19th November 2007
Final Project --- Hand-out Revisions
I have made some revisions to the hand-out about the final project. The most important of these is an added paragraph on intellectual integrity which was made in response to a recent memo from the Wharton Vice Dean of the Undergraduate Division.
The other important change is that I will now need two copies of your final project report --- an electronic copy (via email) and a hard-copy (in my office mailbox).
Main Business --- Cointegration and its Application
To day the plan is to develop the theory of co-integrated series and the application of cointegration to statistical arbitrage. There are many of variations on this theme, but we will be particularly attentive to pairs trading.
This is a class of strategies that has bought more than one nice house in Connecticut.
First --- Spurious Regression
We'll begin with one of my favorite simulations.
Simulate two independent random walks, store the values in vectors x and y, regress y on x, and WHAM --- you find a highly significant alpha and beta almost every time.
Since we know that x can not tell us anything useful about y, we know we have a spurious regression.
Next, we'll look at the way out of the trap --- testing that the residuals are an I(0) process. If the residuals are an I(0) process we are safe (or at least in no more danger than usual). if the residuals fail to be an I(0) process, then we almost certainly have a garbage regression.
We'll look at some resources that add further intuition to this process, including the famous "Drunk and Her Dog" story.
Finally we'll look at some ideas from statistical arbitrage including the idea of a synthetic index and methods of pairs trading. I've started a resource page on pairs trading and I will add to over the next week or so.
Sidebar: News Impact in the Classical Sense (Kobe and Katrina)
How much does news move the markets? This is the question that is addressed by what are called event studies, and there is a nice summary of some of these in Robert Shiller's book Irrational Exuberance.
I was led back to this by the Wiki piece on Nick Leeson which noted that Leeson's troubles began with the Kobe Earthquake.
Oddly, the Kobe scenario was one of "bad news travels slowly." The day one reactions were minor, but after ten days the Nikkei 225 had fallen by more than 8%.
One of Shiller's theses is that market impacts are sometimes the result of news cascades; that is, the drumbeat of news stories can have more impact than the initiating event. Since Katrina was post the publication of Schiller's book, you might see if Katrina fits into his mold. This won't really make a whole project for the final, but it would be a nice investigation to share with the class.
Two Reminders:
If you will be in class on Wednesday before Thanksgiving please do bring any old tennis balls that you happen to have. We'd like to have three for everyone, so bring extras if you can. The second reminder is for you to send me email if you are missing a partner for the final project and you would like to have one.
Sidebar: Volatility in Perspective -- "Two Percent Days"
Day 20: Rolling Statistics and Momentum Strategies
For 14th November 2007
It never pays to ignore what you know, so any forecast, strategy, VaR level, or performance measure needs to be constantly up-dated as new data arrives. The main part of our plan is to review the tools in S-Plus that make this easy.
The main tool is aggregateSeries(). This is a very general tool that makes it convenient to do "rolling anything."
We'll also look at some of the most ancient tools of time series analysis, the exponential weighted average. This is an all-purpose tool that is often used in combination with other, more sophisticated, time series tools.
We'll see how it is used in the MACD, which is reported in many graphical packages, including the free on-line chart service BigCharts.com
MACD is goofy in some ways but it has fascinated me for a long time, because it so often looks like "it works." Unfortunately, formal tests with individual equities mostly come back with the verdict: "No extra cheese."
I keep looking for the context where MACD really does pay the rent.
My sense is that it has a good chance of working well in currencies, and in style spreads --- say small cap value vs small cap growth. It might also be useful in making guesses about sector rotation. Exploration of one or more of these ideas might make a good project.
Finally, we will look at a resource page on momentum strategies.
It has a CitiGroup FX Advisors presentation, and summaries for a few leading academic papers on momentum. The CItiGroup piece will give us some examples of strategy evaluation. It's long, but we will cover much of it. We'll look at the academic papers only if we have time.
Side Bar: Short Vol and Sad Days
Straddles, Nick Leeson, and the collapse of Barrings Bank
Day 19: Comparing GARCH Family Members
For 12th November 2007
Now that we have a substantial family of GARCH models, how should we choose between them? The plan is to first consider some structural features, especially the connection to the Wold representation and our old bête noire --- stationarity.
One useful way to compare the many animals in the Garch Zoo is by looking at a plot called the "new impact curve." Given two models we first find appropriate values for the parameters of the models, say by fitting both to the same data. When then fix those coefficients and consider the the conditional variance as a function of the innovation epsilon_ t.
This function tells us how the two models will differ in the importance that they attach to a given shock. This measure is not perfect, since it speaks to just the impact of one shock. Still, it seems to be informative, and it is easy to implement (see e.g. S-Code Ex.)
The picture we get give some intuition about which models "care" most about a negative shock versus a positive shock. Still, the pictures are not perfect, since it is not always easy to say which parameters values are "comparable" when one looks at radically different models. One way to make progress is to fit both models to the same data. Unfortunately, this begs another question; namely, the question of model specification.
Next, we consider non-normal drivers of the GARCH model. This is an important issue that makes the GARCH model much better than it would be otherwise. Still, the trick is old, going back to Bollerslev (1986).
Finally, we dig into the 2001 paper of Hansen and Lund which compares some 330 GARCH models. This is a heroic effort which we will be delighted to cover only from the summaries. Still, there is room to note a fundamental philosophical point. To compare one needs a criterion. How is one to choose among the potential criteria? My favorite is fitness for use, but this is not always feasible.
There is anther principle that I like. You could call it simulated verisimilitude. You fit the model, then simulate data from the model, then do EDA on your simulated series and your original data. If the EDA (and other logical) comparisons are not pretty close, then you have good reason to be unsatisfied with your model.
It is amazing to me how seldom this method is used by model builders in operations research, scheduling, logistics, transportation, etc. Those guys very often use models that have very little relation to the stylized facts of their business. In financial time series, we do at least have this part of the drill down pretty clearly.
Addendum: Wilhelmsson (2006) also deserves some class time. One nice feature of the paper is a break-down 1995-2000 and 2000-2005 of the fundamental features of the SP500 returns. These are very useful for calibration of one's intuition about returns --- and hence for "Fermi" calculations. This is his Table 3, and it is not his main message, of course. The main message is that it pays to deal with kurtosis (fat tails), but may not pay to deal with skewness (asymmetry about zero). This is surprising, and it may not hold up. Still it is interesting.
Winners and Losers: The size of the world's bond market (55T?) and world's equity market (45T?) are comparable in a "Fermi sense." Historically, equities have clobbered bonds. Moreover, bonds are hardly risk free. For example, the bonds of the Weimar Republic became worthless, but the stocks did not. On a less dramatic scale, you can have a very rocky road with even a 30 year US Treasury --- a 1% rise in interest rates can cost you perhaps 25%, depending on the initial interest rate. So, why are there so many people, businesses, and governments who are happy to own bonds? How does this fit with our "counter party" theory of strategic investing.
Last Homework! This homework provides experience using a GARCH model to engage something that is of bottom line interest --- the relationship of risk and reward. As it is presented, it is reasonably straightforward. Nevertheless,t if you have time, you can use it to do a little exploring for your final project. It also provides a reminder of the very on-going importance of basic regression and EDA studies.
Next week will be the Monday and the Wednesday before Thanksgiving. There will be no homework over the Thanksgiving weekend. Moreover, after Thanksgiving all our efforts will be focused on the organization of the final projects (proposal, proposal presentation, and final report).
Day 18: The "Leverage Effect" and the GARCH ZOO
For 7th November 2007
The GARCH model is a major step toward a realistic model for the noise in asset return series, but it is not perfect. In particular, plain vanilla GARCH responds symmetrically to either a negative or a positive shock. Historically, it is the case that a large negative shock has a more substantial impact on subsequent volatility than does a positive shock.
Fisher Black (partner with Myron Scholes in the Black-Scholes formula) called this phenomenon the "leverage effect" and the name has stuck. Black gave an interpretation of this empirical phenomenon from the point of view of the firms debt to market capitalization ratio. We'll do a Fermi calculation to see if this interpretation holds up as sturdily as the name.
One point to note: Black's leverage story may seem to contradict the Modigliani-Miller Theorem. If it did, it would not particularly bother me. Still the problem is worth pondering. I'll argue the view that there is no contradiction because the Modigliani-Miller assertion is about value, and Black's leverage story is about volatility. Now volatility does effect value, but subtlety --- through volatility drag from our perspective, but surely not enough to make us regard the MMT and Fisher's leverage effect as contradictory.
Cultural Note: Franco Modigliani --- an American --- pronouced the "dig" in his name. Amedeo Modigliani --- and Italian painter --- did not. The later's life was textbook bohemian.
We'll then look at the models that attempt to cope with the so-called leverage effect. Most of our attention will be given to Nelson's EGARCH model, or exponential GARCH model. This is the "next step" model that has best stood the test of time. It is definitely useful, though it is not nearly as big an increment to our toolkit as GARCH itself.
After EGARCH there were many other models that attempted to deal with this or that stylistic fact that is not well modeled by GARCH. Naturally, one eventually faces a certain law of diminishing returns. Still, it pays to know about at least a few of these.
We'll also look at some relevant examples in S-Plus. It does indeed turn out that when you fit a model like EGARCH to the returns of an individual stock, you are very likely to get a significant value for the leverage parameter.
It's not easy to say what this really means to us in an investment context, but it is certainly worth thinking about.
Leverage Effect not a Leverage Effect
For year's I have argued that Black's interpretation of the "leverage effect" as a "leverage effect' didn't really make sense, and II figured that everybody knew this.
Turns out that there was still a paper to be written, so if you want (substantially) more than what comes with our Fermi calculations, you can look at a nice 2000 paper of Figelwski and Wang.
Sidebar: Risk and Reward
There is a piece on the risk-reward trade-off posted at CXO that is worth a quick look. Some parts of the piece are confusing, but it puts interesting questions into play. The introductory story should make sense to you, and, if you get interested the original paper is worth a look.
The big picture here is "Do you get compensated for taking incremental risks --- or is it the case that for any given asset incremental risk (as measured by "volatility") is an a priori bad thing?"
In the classical stocks versus bonds story, we see historically a very reassuring compensation for risk taking, but through time and within one asset class the story comes close to reversing itself. You'll get to explore this in HW9.
Day 17: ARCH and GARCH
For 5th November 2007
The ARIMA models underpin almost all of the theory of time series, but they have an Achilles heal when applied to financial time series --- the conditional variances of ARIMA models do not change as time changes.
For financial time series, this is in violent contradiction to reality.
One of the most fundamental stylistic facts of asset returns is that there is "volatility clumping" --- periods of high volatility tend to be followed by periods of high volatility tend, and periods of low volatility tend to be followed by to be followed by periods of low volatility.
The ARCH and GARCH models were introduced to remedy this situation, and they have led to models that are much more representative of financial reality. Our plan will be to develop these models as they evolved, first looking at why they are really needed. We'll also look at the tools in S-Plus for handling GARCH models, either in simulation or in fitting.
Finally, we'll discuss some original sources, notably a review article by Robert Engle called GARCH 101. The notation used in this piece is no longer the standard notation, and some bits --- such as the discussion of VaR --- are best taken with a grain of salt. Still it is fun to take a look.
Another paper we might discuss briefly is Engle's paper with Andrew Patton "What Good is a Volatility Model?"
Ironically, this paper has the "tell" that I have mentioned in class, namely it uses the Dow (OMG!) as its illustrative price series. I don't know what motivated this choice, and I find it a little less serious than I would have hoped. A positive feature of the paper is that it gives a brief list of "stylized facts," a very important notion to which we will start paying more systematic attention.
Bug in Excel 2007
MathGeek.com has a nice observation:
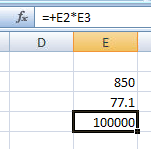
How could this happen? Consider E2*E3 and think about powers of 2, less one. This reminds me, fans of Excel should be reminded that "friends don't let friends use Excel for statistics."
Sidebar: Cracks in HK/US Exchange Rate?
A Forbes reporter sees some big hints. One way to play is with Hong Kong ADRs. Of course, you may still have some itsy bitsy concerns that there will be a Shanghai meltdown that will have spill over in Hong Kong. Can you perhaps find an ADR that would be neutral (or positive) to a Shanghai sell-off?
Note! HW7 has been updated
As I mentioned in class I have made a modest change to HW7, deleting the request that you use Bonferroni-Holms. We will cover this technique later.
Day 16: Switching Regressions, Non-Linearity, and Forecastability
For 31st October 2007
Our main goal is to review an interesting discussion paper by Clive Grainger, "Forecasting Stock Market Prices: Lessons for Forecasters." Grainger received the 2003 Nobel Prize in economics and he as few peers in the world of econometicians.
It is worth attending to his words, and, even if this paper is a little dated, it has some big benefits. First, ii can be 95% understood at the level of Stat 434, and, second, it suggests some very useful ideas that are still not fully explored.
If anyone is looking for advice about how to have better luck forecasting asset returns, this is a very sensible place to begin.
We may also discuss the tools that are available in S-Plus for dealing with dynamic regression. Rolling regressions and weighted rolling regressions are a staple in many of the Stat 434 final projects, but at this stage you can probably learn everything that you might need about these tools just by working through the code box example.
Sidebar: Citation Searches
When you find an article that you like, you can find more recent articles that follow up on it by doing a citation search. This is typically a much more efficient way to find relevant research than just by looking up a topic. In particular, if you look up a topic that is too broad --- like forecasting --- almost no one can thread his way through the forest. Citation searches are a very powerful research trick.
Sidebar: Volatility Drag
We'll also discuss the formula for volatility drag.
This may offer some explanation of why the "2x" leverage funds do not provide returns that are as large as one might have expected given the returns of the underlying asset.
Resource Note: Risk Free Rates
For a CAPM style modeling exercise, one needs "risk free rate." Exactly which rate one might choose is open to debate, but 30 day treasury yields are usually appropriate. When you put any rate into the regression you will naturally have to make sure you are comparing apples and apples --- i.e. daily stock returns and daily risk free returns. To convert treasury yields to daily yields, you can use the conventional 360 day year. For data resources you have several options.
Sidebar: CAPM and Other Puzzle --- What Changes a Mind?
“Children do eventually renounce their faith in Santa Claus; once popular political leaders do fall into disfavor…Even scientists sometimes change their views….No one, certainly not the authors, would argue that new evidence or attacks on old evidence can never produce change. Our contention has simply been that generally there will be less change than would be demanded by logical or normative standards or that changes will occur more slowly than would result from an unbiased view of the accumulated evidence.” ---Nisbett and Ross (1980), quoted by Hong and Stein (2003).
Incidentally, this quote is consistent with the notion of confirmation bias which asserts that a person holding a view is more likely to be attentive to evidence that supports his view than evidence that does not. Confirmation bias is a feature of human psychology that has been demonstrated in a great variety of experiments.
Sidebar: Remembering: October 30, 1961
Tsar Bomba was detonated at 11:32 a.m. on October 30th, 1961 over Novaya Zemlya Island in the Arctic Sea. With a lead tamper, the bomb had a yield of 50-60 Megatons, more than ten times the explosive force of all of the explosives used in the Second World War --- including the atomic bombs of Hiroshima and Nagasaki. Tsar Bomba was a very clean bomb, as essentially all of the fallout would come to rest on the USSR. With a more "traditional" design using uranium tamper, the yield would have been perhaps 100 megatons. The Tsar Bomba is the most powerful bomb to be detonated on Earth --- so far.
Day 15: Time Series Regression and Applications to CAPM
For 29th October 2007
The plan mostly focuses on the natural extension of ordinary least squares regression (OLS) to financial time series. Still, there are new topics, such as the likelihood ratio test and the AIC criterion. We'll particularly look at AIC, AIC weights, and the way to use these to combine forecasts.
We'll look at the nuances of the model and its associated tests. We may also cover a MSFT/CAPM example that is bundled with Finmetrics, but you can just as wall look at this by yourself.
One of the most famous models that fits into this context is the 1992 Fama-French Three Factor model. This is the model which for many (but not all) signaled the "death of the CAPM."
Parallel to the Mark Twain line, the rumors of the death of CAPM may have been greatly exaggerated.
Nevertheless, the true believers are starting to face a sea of troubles that are almost as tough as the ones face by those who preferred had a hard time with heliocentrism.
The Wikipedia article on Fama describes the three factor model, and it also has useful links, including one to the original FF92 paper and a good humored one to a Dartmouth humor magazine.
If you do look at the original lFF92 article you will see that there is a fair amount of technology there which we have not engaged. Still, with the tools we do have you can tell very similar stories. The basic tale is pretty robust. It's time to list it as one of our "stylistic facts."
Maximum Likelihood and the ML Ratio Test
Basically all the test that you have seen in all of the statistics courses that you have taken are obtained by on general method, and they are all what is called a maximum likelihood ratio test.
The computations behind these tests are a basic part of other statistics courses, but we still to well to review a bit of this theory. In particular, it gives us the chance to nail down the very fundamental notion of the likelihood.
This is critical for maximum likelihood estimation, for the likelihood ratio test, and for other cool stuff like the AIC, which comes up next.
Akaike's Information Criterion and Model Averaging
I'm not a huge fan of Akaike's criterion in its traditional role as a way to select a model from a class of models. The problem I have is that in many cases one assumes at least as much going in as one hopes to infer coming out. In pure model selection there may be some net gain in most cases, but, since there can be loss in some cases, it is not clear that one wins over all.
Still, the AIC is out there, and it mostly seems to point in the right direction.
It's probably worth consideration in most contexts, provided that one does not get too carried away. Moreover, there are ways to look a the AIC statistic that have more value than pure model selection may suggest.
There is a Laval University Ph.d. thesis that has a useful appendix on the AIC that is as informative as anything that I could find.
You may want to skip a little history at the beginning, and you can surely skip the part about the desiccated frogs(!), but over-all the piece makes a lot of sense to me.
We can make it part of our conversation. I particularly like the straightforward approach it gives to model averaging. I would not average estimates as the piece suggests, but I would average forecasts --- as we see in class.
Sidebar: "120/20 Good Buddy"
Among the strategies that now have the public ear are the 120-20 strategies ---- leverage up 20% on the long side and off-set this leverage by going short for an amount of 20%.
Naturally, such a strategy would be nuts unless you could pick winners for at least part of your up-position and pick mostly under-performers for your short position. As a retail investor, you would also face an 8% headwind on the up-side and a 5% (plus dividends) headwind on the downside.
Thus, for an individual this is a non-starter.
As a professional investor, your long position will cost LIBOR and a bit and your short position will pay LIBOR minus a bit, so for professionals the whole game becomes modestly feasible.
Thus, professionals have the opportunity to let you in on this game --- for a modest fee, of course.
This is a good trick all by itself, but the 120/20 pitch has a ready listening. You can look at some of the recent pitches.
My own view is that these retail issues are shorts. The challenge is to find an efficient way to short them while taking care of risk as best you can. Also, if you are looking for a final project, you might want to consider a project that plays off of these funds.
Sidebar: "Is RSP a Stinker?"
Just as a side note, you might want to think about a project that plays RSP versus MDY or VO. My best guess is that RSP is almost a dominated asset, or at least a stochastically dominated asset. My guess is that you will almost always be able to beat RSP with MDY (or at worst a blend of MDY and SPY).
Yet more strangely, I bet you can dominate MDY with VO. This needs to be checked, but if it pans out then one finds yet another place where investors could save a few tens of millions of bucks (per year)..
Flash News: Job Listing and Interview this Friday (10/26)
I received mail from a former student Shobhit Verma who is now working for CCG Strategies Group which is the commercial quantitative group within Constellation Energy, the largest wholesale power trader in North America and one of the largest traders of natural gas. The candidates are requested to email their CV to shobhit.verma@constellation.com as soon as possible to be considered for an interview this Friday October 26. If this position interests you, and you miss the Friday opportunity, you can still contact Shobit and arrange a telephone interview.
Day 14: VaR, Extreme Values, and Risk Adjusted Returns
For 24th October 2007
Today (D14) we will look at the most widely used structures for expressing risk exposures:VaR, or Value at Risk. (Historical Review VaR).
Sadly, there is much wrong with the way VaR is used and calculated --- in even the most enlightened firms.
It is used almost universally --- often as a regulatory requirement --- but many implementations are far off the mark. Some implementations are close to (1) a hoax or (2) naively self-delusional.
Still, by and large, the implementers are sincere, and many have done their best. Moreover, in at least some cases, I do not know how to do better.
Still, if one could simply bet against run-of-the-mill VaR estimates , one would not need to look for no other investments. This would be a "Taleb's Dream" come true --- a veritable paradise of Black Swans, vastly more lucrative than those (too rare) Black Swans that stingy options traders occasionally provide.
There are two virtually insurmountable problems with VaR as it is calculated in most firms. These are the "Peso Problem" and the "everything is correlated at the extremes problem. "
The former is a standard part of economic theory, though ignored by essentially ALL VaR models. The later is widely understood to have been one of the forces that led to the demise of LTCM, yet it is conveniently ignored in 99.9% of VaR models.
RiskMetrics is a consulting firm that had its origins in VaR calculations, including daily estimated variance-covariance matrices of a large set of assets. This was in the early 90s. Once upon a time, they also provided teaching materials for VaR, but these have gone away (one only has the Cashed Index) .
RiskMetrics has had to do a considerable amount of self-reinvention to stay viable --- and VaR does not now seem to be a major part of their current product line. A previous Stat 434 page may have contributed to some changes at the RiskMetrics site.
John Tukey understood all of this, even before the ideas came into play in a financial context.
With a barrel-chested sotto voce rumble, he would say, "The variability that you have seen is always an under estimate of the true variability." In our context, where volatility and variability are cognates, Tukey is on one side, and the world's VaR models are on the other.
My money is on Tukey.
Still, many firms are getting better at VaR, and we just need to have evolution play its role. Though many individuals in many firms will kick and scream, the big firms with the best VaR models (and other risk controls) will be survivors. As the "subprime" story plays itself out, we are likely to find that many firms had VaR estimates that were pure garbage. We'll see.
On the more technical side, we'll look at extreme value theory, which is one of the tools that theoreticians always seem to want to trot out when there is a discussion of big market moves. The mathematics of the extreme value distributions is interesting, but it doesn't deal with the reality of market moves.
Still, extreme value distributions are worth learning about. There are certainly special context where they are applicable, and they have undeniable charm. The also give us a chance to discuss the some core ideas of simulation, including the rejection method and the inverse probability transform method.
FInally, we will look at some suggestions that have been made for comparing returns on a risk-adjusted basis. These are useful --- certainly better than simple raw returns --- but they still can lull us into forgetting the peso problem. The Wiki piece on the Sharpe Ratio gives the basic definition, though it is a little short on motivation. The piece also has links to a bunch of related ratios, some of which were new to me. Almost all of the final projects will need to deal with risk-adjusted returns in one way or another. At some point in life, everyone should read Bill Sharpe's Original Article.
Finally, here is a somewhat dated table of Sharpe Ratios from our friends at Merrill Lynch. This should be considered in light of the Bloomberg piece on their recent write-down.
Day 13: Stationarity and Unit Root Tests
For 22th October 2007
We've already discussed stationarity to a considerable extent. We didn't have any choice.
Stationarity is the assumption that gives us a link to the past. Without stationarity, we have (almost) no way to learn from what has gone before. It is natural then that economists and others would hunger for ways to test for stationarity.
We know from the "cycle construction" that this is impossible in general, but how about in the specific? For example, one may be willing just to test for stationarity while assuming an ARMA structure. An ARMA model may be stationary or non-stationary, so there is indeed something to do even in this confined context.
The fist and most famous of such domain-limited test is the Dicky-Fuller Test (1979).
DF is in essence a "t-test" but the corresponding tables for p-values just happens not to be the famous t-table. The relevant distribution theory actually depends on Stochastic Calculus, and we may chat about this if there is time. As a practical matter, one just uses S-Plus to find the relevant p-values.
The Unit Root code fragments explore the augmented Dickey-Fuller tests and comment on some examples described in Zivot and Wang. In the example for log-exchange rates and for stock prices we fail to reject the null hypothesis that there is a unit root. For stock prices this is certainly no surprise, but for exchange rates it may not have been expected. Such economic ideas as purchase price parity might have pointed toward stationarity. Still, for PPP to come into play, one needs to deal with the separate inflations in the two countries. As the example of Brazil shows, one can have something close to PPP yet have exchange rates that are flamboyantly non-stationary.
As much as one wants to test for non-stationarity, our technology is not particularly compelling.
I expand on this in a little"cultural" piece on unit root test.
Oct 19, 1987 --- Happy (?) 20th Anniversary
The market did not quite tank today (10/19/07) , but a 2.56% drop in the SP500 is not a welcome event for many people.
You also have to stir this into the pot with two further facts: (1) volatility (especially down-volatility) is usually followed by more volatility and (2) actual net drift tends to be lower during periods of higher volatility.
The second of these stylistic facts actually contradicts the old bromide about increased returns as compensation for increased risk.
To be sure, there are instances of such a relation when one compares different asset classes. For example, there has almost always been a positive risk reward relationship for stocks versus bonds.
Nevertheless, for the over-all market, average returns have been lower when average volatility has been higher.
Still, life goes on --- we've just given back part of what is still a nice six weeks. I just have my fingers crossed that the market does not put together a long string of such unfortunate days. Here is a table that was published last February after a big (two percent plus) decline that started in powder-keg Shanghai.
The attached table is interesting, but it needs careful interpretation. For example, how does 10/19/87 figure in?
Sidebar: 2x Leveraged SP500 ETFs etc
You might amuse yourself by looking at the Google Graph of SSO for say six months. SSO is an ETF that is designed to provide twice the return of the SP500, minus a one-percent fee and a tad of slippage. Being bright folks, you would put the beta of such an asset at 2, plus-or-minus a little.
Google puts it smack at 1. Is this just a mistake, or does the asset have unexpected behavior?
There is an instructive article on leveraged ETFs on SeekingAlpha. The piece is a little confused about something that we will cover later (volatility drag), but it has many useful refinements on the common conversation about leveraged ETFs.
For us, one benefit of the article is that it gives the historical match up of the CEF versions of many of the newer ETFs. These older CEFs have histories that are long enough to be useful for us, while the ETFs may not.
Analysis of these CEFs is likely to turn up some pretty weird stuff --- and for us, weird stuff is good stuff. You might think about these assets when final project time rolls around. This is not a plain-vanilla project plan --- but it is one that can be, shall we say, interesting!
Final Project: Advance Information
We're just at the half-way mark, but some people have already asked about the final project, so I have posted an overview of the final project process.
This is a four-page document with lots of detail, so I won't repeat it here. There is plenty of time for discussions that should fill in any missing details. There are also time-line details to be added.
Still, you might take a look. The projects are due on December 12, and this is early in the exam schedule. Also, you might review the earlier note for time and place for delivery.
Day 12: Martingales, Probabilities, and EMH
For 17th October 2007
We will discuss the every useful notion of a martingale.
Martingales were originally introduced to provide models for fair games, but they have evolved to become what many people regard as the most important notion in all of probability theory.
The plan will only require a few intuitive observations about martingales before coming up with some wonderfully concrete results, such as the famous formula for the probability of ruin (i.e. losing all you money).
Martingales also help us be more precise about the EMH and about the ways one might measure the extent to which a money manager may have significantly out-performed the market --- or not.
News Flash: Bank of Sweden Prize --- and Bayesian Models
For 15th October 2007
It was announced today that three American Economists have received the 2007 Bank of Sweden Prize in Honor of Alfred Nobel. The winners are Leonid Hurwicz (University of Minnesota), Eric S. Maskin ( Institute for Advanced Study, Princeton), and Roger B. Myerson (University of Chicago).
The scientific background paper for the prize announcement should be interesting reading for many of the students in 434, especially those who know a bit about game theory or Bayesian models.
The models are too far afield for us to discuss in class, but, needless to say, expected utility is a huge diver of the work --- even though, in the Bayesian context it has a mildly Quixotic taint.
Sancho and his liege the knight errant Don Quixote may have the same utility for slaying a dragon but they can have different expected utilities --- based on different prior beliefs about the thing they see either being a real dragon or or simply being a windmill, as to most of us it would appear to be.
Going back to economics, understanding the potential for ambiguity in expected utilities is a good thing to understand. It may even suggest why some markets flourish and other dry up. In fact, this is a big part of the story told by the new Nobel Laureates.
Day 11: Betting on an AR(1) and Introducing the EMH
For 10th October 2007
The first item on the Day Plan is to develop the conditional Kelly Best sizing formula for the AR(1) model. We'll then do a Fermi calculation to gain some intuition about this formula.
The next item is to take a long look at Homework 5, where at last things start to get serious. This is a homework where you get to exercise some honest personal judgment. There are lots of choices to be made, and you get to make almost all of them.
We have no class on Monday October 15 (due to Fall break) so Homework No. 5 will be due on Monday October 22. This gives you a big chunk of time to devote to the HW, if you are not otherwise occupied. If you attempt the optional part of the assignment, you really do need to keep you eye on the "Fermi-type" reasoning. The general algebra may be "optimal" in some sense, but you will find that a back-of-the-envelope calculation will provide all the honest guidance that you need. This is especially useful --- for interviews, or if the algebra never "converges."
The second part of the agenda is to open the conversation about the Efficient Market Hypothesis (EMH). Everyone seems to know what this is all about until someone says --- "great,lets write this out as mathematics."
At that point almost everyone starts to become uneasy. The fact is that that there are some some hard --- and debatable --- decisions must be made. Our first step will be to round up the "usual suspect." We'll then see what comes out in the wash.
Incidentally, I have collected some sources on the EMH that may be useful to you, and you will surely have loads of material from your other courses. The resource pool is virtually unbounded.
Finally, whenever we have a free moment, we should discuss the Nuveen Funds. These make interesting series for analysis, even though some of the time series are short (i.e. less than three years).
Please don't forget the previous note about the final project due dates.
Incidentally, if you want to prepare for an interview with Google or with a quantitative group on Wall Street, you might work through one of the collections of Fermi Problems. Moreover, if you are a SETI sort of person, you will be well amused by consideration of the Fermi Paradox .
Sidebar: Coaching on Writing
Many of you will end up being compensated to a large degree for (1) your personal presentations and (2) your written presentations. Thus, your future net worth depends to an amazing extent on your ability to maximize the effectiveness of both of these forms of presentation.
Here is a very big hint that works in both of these situations: You should assume that the person you are speaking to someone knows almost everything that you do. This means that you can --- and almost always should --- "jump to the chase. " Trust that your listener or reader can follow you, and trust that there is a ready listening for what you have to say that goes beyond the normal.
Focus as much as you possibly can on what you have that is new, special, or out of the ordinary. When you write for a general audience of the craft is to make sure (without insulting the audience) that the" ordinary" is indeed collectively assumed.
In most cases (say in our class), this is not a problem.
Day 10: What to Do When Facing A Favorable Bet
For 8th October 2007
Naturally, we want to discuss the Homework 3 (being returned) and Homework 4 (coming in today).
The Plan for Day 10 then has us review the Law of Large Numbers, and apply it to the attractive but controversial notion of long-term growth rate of wealth. This rate will then lead us to the famous Kelly criterion for bet sizing. We will develop this in some detail.
For some richer context for the Kelly Criterion, you might want to browse my brief page of Kelly related links. I will add more to this page as time goes on, so you may want to revisit it when you start to think about your final projects.
Finally, we will see how the Kelly criterion relates to a classical paradox of utility theory, the famous St. Petersburg Paradox. As our discussion is unfortunately brief, you might want to look at comments on the Paradox by Shapley and by Aumann. These are very distinguished economists, but you will find their comments completely within your expertise. Part of the bottom line seems to be this: however odd it might seem a priori, one probably does have a bounded utility function.
When are the FINAL PROJECTS due?
Your final projects are due on Wednesday December 12 at HIGH NOON. Naturally, you can hand the project in earlier if you like. This date was determined by the 2007 University Schedule for Final Exams. Please note: This is a scant one week after the last day of class, so you really want to have a firm grip on your full project by the time of your "project proposals" on in the last week of class. Most of your proposals will be fine, but some people will need a "mid-course correction" and this is not so easy with just one week.
The PLACE the project are due is my mail box in Suite 400 of JMHH.
If the mail box seems insecure to you, you can slip your paper under my door (447 JMHH). You should keep an electronic copy of your project and be able to provide that electronic copy ASAP if I don't find it among the papers that I receive in my mail box or under my door.
Pease see the policies page for information about the penalty for late projects, etc. This is very important.
Partner Issues?
Some people have had partners drop the course or otherwise go AWOL.
If you are missing a partner, or want to explore a change, I suggest that you stay a little while after class today to meet like-minded others.
Day 9: Lynch? Not Peter or Merrill ... then Back to Business
Posted 3th October 2007
Just as an aside, I'll mention some time series relations that some of my colleagues have recently discussed. The series in question deals with a sad part of American history --- lynchings in the Southern States from the period of reconstruction (1880's) until the depression (1930's). The key figure in the article has suggested to some that there was a relationship between cotton prices and the number of lynchings.
These series set some traps. It would be easy--- and wrong --- to trot out an analysis that ignores: (1) spurious regression in time series (a topic we take up later) (2) the notion of cointegration --- or the lack thereof (another future topic) or (3) the probably poor quality of the data --- not of cotton prices, but surely of lynchings --- the reported number of which were under the political control of the states.
Even given the scholarly source of the data, I view it as quite possible that the recorded number of lynchings could easily be off by a factor of two (especially on the low side) in any --- or even most --- of the given years.
Lastly, the use of annual data makes the series very short. Given the humble efficiency of our methods, they are certainly too short for one to address honestly the issue of co-integration.
Oddly enough, the whole puzzle does echo an interesting issue in behavioral finance --- namely the constant stalking horse of confirmation bias.
Main Business --- Estimating ARIMA Models
So, with that piece of advertising of future topics, we'll deal with today's plan.
Important for us will be the use of arima.sim for simulating ARIMA series and arima.mle for fitting ARIMA series.
Naturally, we'll also discuss the new homework HW4 as well as whatever else shows up.
Operational Issues --- Missing a Partner?
I'll give a pitch in class today about the value of having a partner. If you find yourself working alone now, and you'd like to partner up, please send me a note. I will match people up as best I can. Partnerships are particularly useful during project proposal time and project delivery time. Still, there is no need to stick with a partner who is not pulling the full weight. It may be time for some serious partner-partner discussions.
Day 8: ARIMA(p,d,q) --- Adding the "I" and the "MA"
To be Posted for 1th October 2007
Our first task will be to survey your discoveries with the expectation that you will have gained some basic experience with the most fundamental of the stylized facts --- except in the luckiest of circumstances asset returns are not normally distributed.
The rest of the Plan for Day 8 focuses on the key theoretical features of the general ARIMA(p,d,q) models, including the issues of general issues of stationarity, invertability, and identifiablity.
One of our theoretical pieces is the construction of a stationary process that essentially proves the impossibility of testing for stationarity in the broad sense in which we have defined it. We will later discuss tests for stationarity in more narrow senses, and it will be up to you as a modeler to decide which description best reflects your world.
Sidebar: Ergodic? "I don't need no stinkin '' ergodic ... "
You might want to take a look at an amusing popular essay about ergodicity.
It is fundamentally correct, but I can't honestly say what one would infer from the article, if one did not already know the formal meaning of ergodic.
Still, it is consistent with our definition and it possibly adds some intuition.
There are several layers to this puzzle. John von Neumann once said: "We don't understand mathematics, we just get used to it." Well, the notion of "ergodic" is somewhat the same. We can master the definition, but mastery of the real notion just takes lots of "getting used to."
Incidentally, John von Neumann also had a role in the use of the word "entropy" in information theory. Claude Shannon asked him if he though the use of the term was appropriate, and von Neumann said "Go ahead and use it. Nobody knows what entropy means anyway."
Well, about von Neumann --- John Wheeler once said, "There are two kinds of people. Johnny and the rest of us."
Finally, the definition of ergodic in Z&W is not 100% up to snuff.
Their definition and ours will coincide for Gaussian processes, but even our first brush with real asset data tells us that in our business we can't expect to see too many of those.
Day 7: The Full AR(p) model --- Features and Choices
Posted 26th September 2007
The main part of the plan is to introduce the general AR(p) model. We'll discuss the historical contribution of Yule, his equations, and the ability to pick up periodic behavior, such as one finds in the famous sunspot data. We'll also put together the tools one needs to discuss stationarity in the AR(p) mode.
One issue of clear practical importance is that of choosing choosing an appropriate value of p. In general, this is a problem in what is called "model selection" We'll also open an important conversation about "parsimony" in models: miracle, credo, or a practical and well-founded heuristic?
We'll do some mathematics --- in part because it is honestly important for understanding the AR(p) model and in part because I want to remind everyone that --- however powerful simulation may be, it one needs lots of analytical insight to know what to simulate. So, it is time to warm up your partial fractions!
Day 6: Data Confronts the "Normality Assumption"
Posted 24th September 2007
An important part of the plan is to go over the piece on using WRDS which also covers the importation of WRDS data into S-plus. We'll also discuss HW1 (going back), HW2 (coming in), and perhaps go over the newly assigned HW3.
Sidebar: Pondering the Mysterious Role of Assumption in Models
We'll often simply assume that a series is stationary, though of course we won't be silly about this.
Most price series are clearly non-stationary, and there are even return series that we can't call stationary with a straight face. Nevertheless, experience seems to suggest that most return series are stationary enough for us to courageously push ahead and assume stationarity. Later we will discuss some "tests of stationarity" but to tell the truth, these test are so limited in their power and applicability that they are hardly worth the name.
Normality of the log-price change and independence of log-price changes are assumed in the development of the Black-Scholes model, a model --- and subsequent theory --- that is of rhapsodically beauty.
It is even a useful theory --- when carefully applied.
Still, as we experiment together, we will find that there is seldom much empirical encouragement for us to assume normality of returns (or differences of log-Price).
We'll start addressing the normality part of this set-up with help from the Jarque-Bera and Shapiro–Wilk tests of normality. For a purely seat-of-the-pants practical approach, one still does well by eyeballing the qqplots.
While we are at it, I should underscore that It is important that everyone in the class start sharpening their understanding of the theoretical side of our work --- even as we keep marching along with the practical side. It really is nonsense to suggest that one has a "practical" understanding without a "theoretical" understanding. We'll see lots of examples of the foolishness that can result when one loses track of what he is talking about.
In particular, make sure that your definitions are rock-solid.
For example, write down the definition of independence of two random variables.
Hint: if you use the word "correlation" you have a big gap in your knowledge. What is required is a very simple formula --- nothing else is genuinely true or complete. To be concrete, anything else is simply wrong. It may have mitigating virtues, but it is still wrong.
My concern is this --- if your understanding of the fundamental notion of "independence" is shaky, then the more subtle notion of "martingale" which we well use shortly must be incomprehensible. Without understanding the ideal of a martingale one is almost barred from a fully sensible adult conversation about market efficiency, gambling systems, and lots of other great stuff.
Suffice it to say ---- understand the definition of independence as deeply as you can.
Sidebar: JB in the Wiki --- Some Instructive "Slips"
If you are logically fastidious there are some irksome errors in the Wikipedia description of the JB test. These offer us a useful opportunity to illustrate some important distinctions. Everyone will understand them --- and afterwards they will be part of a small club that does understand them. It's worth the price of admission. Basically, this is the club where "you know when and where you need a hat."
Incidentally the Wikipedia article on Shapiro-Wilk is valid, though it is a little too obscure to be directly useful to us.
Noted In Passing (9/21/07): One Loonie Equals one Buck for the first time since 1976, when I was a post-doc at UBC.

Chronology of the Canadian dollar:
Aug. 20, 1957 - C$1 worth US$1.0614
1962 - 1970 - dollar fixed at 92.5 cents US
May 31, 1970 - Trudeau government floats currency
April 25, 1974 - floated currency peaks at US$1.0443
Nov. 15, 1976 - Parti Quebecois elected
End of 1978 - C$1 worth 84 cents US
Feb. 4, 1986 - worth 69.13 cents US
Nov. 4, 1991 - C$1 worth 89.34 cents US
Jan. 21, 2002 - all - time low 61.79 cents US
Sept. 20, 2007 - loonie and greenback at par, first time since 1976
Day Five -- Autocorrelation Tests --- Especially Ljung-Box
Posted 19th September 2007
The core of the plan is to introduce the notion of an autocorrelation test and specifically to look at the Ljung-Box test. We will also develop (in the context of the AR(1) model) a very cool theoretical tool called the Wold representation. Along the way we will also introduce the lag operator and some more finmetrics tools. We'll also go over the new homework.
Although the original paper Ljung-Box (1979) requires more background than you are likely to have at this point, you can still benefit from taking a quick look --- especially at Figure 1 (page 299) that contrasts the Ljung-Box and Box-Pierce statistics.
Day Four -- The Autocorrelation Function and Simulations
Posted 17th September 2007
We'll go over the use of the autocorrelation function and work out its theoretical properties for the AR(1) model. We'll also discuss an example application of the Finmetrics tool arima.sim which can be used to make quick simulations of a large number of models. As promised, the new homework has been posted.
Day Three --- Introducing S-Plus for Real
Posted 13th September 2007
We covered the day 3 plan, went over the Homework No. 1 Assignment, and worked a bit with S-Plus, including the examples of functions and loops in a baby AR simulation .
As I mentioned in class, everyone will eventually need a Wharton account or a "class account". If you are a non-Wharton student, you can get a class account from the class account link.
Day Two -- A First Model, Modest but Clear
Posted 10th September 2007
Our main goals will be (1) introduce the AR(1) model, (2) make first steps on the idea of stationarity, (3) develop further S skills, including the use of loops and functions.
Please note that HW No. 1 is posted in the e-Handouts, and it is due on Monday September 17. You will also find the more detailed bullet points for today's class in the e-Handouts.
Day One Arrives --- Evolution of a Civil Society
Posted 2th September 2007
On Wednesday, there will be three main objectives, beyond going over the logistics of the class. First, we'll go over the procedural details regarding homework, teams, and the final projects.
Second, there is at less a little nibbling at our first model --- AR(1), the simplest auto-regressive model and the simplest alternative to pure random noise. Over the course of the term, we'll develop considerable expertise with this model, but the main purpose the fist exposure is to help you calibrate the level of mathematics we will be using --- not too high, but not too low
Finally, we'll have a real-time introduction to S-plus which is our main software tool. Before next Monday you are expected to have installed S-Plus Finmetrics on you PC and to have given it a test drive. You also need to complete the student questionnaire and bring it to class. For information on how to install S-Plus and Finmetrics, please see the write-up in the CodeBox.
Note: There are many S-Plus tutorials on the web. My advice is not to bother with them for the moment. We'll develop the tools that we need as we need them, and there are many S-plus tools that we will never need. Moreover, we will work almost exclusively from the command line, and many of the web tutorials are for lower-level courses that rely on the graphical interface which would only stir in confusion.
Still Shopping? What You Need to Know
If you are still course shopping, I may be able to save you some time.
First, everyone in the course absolutely must have access to a Windows PC on which they can install software. The reason for this is that we will be using the software S-Plus with Finmetrics, and this software does not run on Macs or Unix. Also, the software cannot be placed on public machines.
If you are thinking about maybe scraping along without proprietary access to a windows box, I strongly encourage you not to try. From experience, I know this requirement is a deal killer.
Second, I should underscore that this is a course about financial time series. There are lots of applications of time series, and you might think that this course could help you with engineering or medicine or some other worthwhile activity. Unfortunately, that is not the way this course works. Most of our techniques and almost all of our efforts focus on just what is special about financial time series.
Certainly, from time to time, I will mention some of the ways that time series are used outside of financial contexts, but those will just be small parenthetical remarks. The course is about the models and empirical realities of asset returns. If asset returns are not deeply and absolutely interesting to you, then you will miss out on the real fun of the class. The class would be like dancing without liking the music --- possible, but not a good use of one's time.
More Details about the Academic Prerequisites?
We will be writing some programs and dealing with some serious software tools, so it helps if you like such work. We won't be doing a ton of mathematics, but if you can't remember calculus, this is not the course for you. You will also have to have some acquaintance with linear algebra (matrix and vector concepts, matrix multiplication, matrix inversion, notion of matrix rank, etc).
From the beginning we will be using expectations, variances, co-variances, probability distributions, confidence intervals, and multiple regression, so you should have had some solid exposure to all of these. Still, I do not expect that all these tools have been completely mastered. Throughout the course a serious effort will be given to deepening your understanding of the fundamentals. This is a never ending process.
Just how much mathematics, statistics, and "computer sense" you need --- well, it's almost impossible to say.
Strength in one place can make up for weakness in another. In the end, what maters most is whether you look forward to trying your hand at discovering whatever you can about the ways that asset prices evolve over time.
Almost without exception, personal motivation, honest curiosity, and simple commitment will rule the day. These work best when combined with an informed interest in financial markets and a solid self-confidence in your own abilities and knowledge.
What About that First Day?
It's not one you should skip. On of the main tasks will be to sketch out a "mind map" that will provide the big picture for the whole course. We'll also be handling a lot of logistics, such as text requirements and software access. We'll also begin work with S-Plus, our main software tool.
About the Text --- Zivot and Wang Again?
In the Fall of 2008 we will again use the text by Zivot and Wang. I came to this decision, only after much soul searching.
We are really only going to use about a fourth of its many pages, but there is no (legal) way that I could think of getting you just those pages that we need.
I wish that the book were (1) smaller (2) more focused on what we use (3) more "opinionated" about what works --- or doesn't (4) more generous with coaching about S-Plus (5) more sincere in its engagement of real financial issues.
It is sadly a "computer manual" and a bit of a cookbook.
Still, it is a beginning, and one needs a place to start.
Eventually, I will write my own text for 434, but there is no chance that a workable version will be available any time soon, even 2010 is a long shot. So, we will have to make do.
Naturally, as individuals, you may decide as just buy one copy per team, or you made decide to make more than the usual use of the xerox machine. What I can't do, though I am tempted, is to just copy out the pages that I think you need and make them available as a "bulk pack."
e-Handouts
2007 e-Handouts
GARCH News Impact --- Code Ex.
Dynamic Regression --- Code Ex.
Win Probabilities --- Code Ex.
HW No. 5 --- Due Monday Oct. 22
HW No. 4 --- Due Monday Oct. 8
ARIMA Sim and MLE --- Code Ex.
Yule-Walker --- Richer Context
HW No. 3 --- Due Monday Oct. 1
Is it Noise? --- Richer Context
HW No. 2 --- Due Monday Sept. 24
slots and extractors --- Code Ex.
AR Simulation --- Code Example
HW No. 1 --- Due Monday Sept. 17
Mind Map of 434 (static version)
Resource Pool
^ Top |
Steele Home Page |
About This Web Design
Copyright © J. Michael Steele