A statistics course
committed to honest data analysis,
focused on mastery of best-practice models,
and obsessed with the dynamics of financial markets
Course Blog
Just Browsing?
What you find here is the Course blog for the Fall 2009 Course "Stat 434". I'll keep this page up for a little while, but before summer time it will disappear. If you are shopping now for courses for Fall 2010, you can get an idea of what our course will be like by reading from the bottom up.!
Due Date Reminder: Noon 12:00, Wednesday December 16.
You need to email me an electronic copy (your name on the file name), email me a separate file with your one-page summary, and a hard-copy in my mailbox in Suite 400 JMHS.
Specification Change
Let's follow the suggestion made in class concerning the one-page summaries. Keep your final report organized just as in the Final Project Specification, but also give me a separate PDF copy of your one-page summary. It should have your name on it, and you should say if you are willing to have the summary web-posted or not. This should be sent as a separate author name labeled file when you send me the e-copy of your final project report.
Sidebar: 10 Strangest Mutual Funds
This amusing list contains --- with 9 other equally strange funds --- the VICEX fund that aims to be socially irresponsible. I found this at abnormal returns, which is a blog that I do check out at least once a week. Today's blog (12/12/09) was particularly good.
Presentations --- Notes and Comments:
These were all first rate presentations. Everyone stuck to the very tough time constraints, and all the presentations were well prepared. There was also great coverage: nice cheese hunts, searches for stylized facts, and investigations of the hard to investigate --- bubbles and crashes. Every presentation showed honest understating of what the course is about. That is a nice achievement.
When I looked for the coaching I could provide, I came up with a very modest list:
- Please do write for yourself early on a set of "variations on your theme". You may decide that one of these variations is more interesting than your original theme.
- Please keep a tight reign on your very noble ambitions. Progress comes "one brick in the wall at a time." For almost all of us almost all of the time, it is better to put a well-seated brick in the wall than to "go where no man has gone before".
- Still, it's you nickel. Do what most interests you, and it will work out right. Just don't confuse yourself with the complexity of your theme, and don't let data issues use up more than 20% of your time --- at most!
- Please be damned careful with definitions. Give your "normalizations" etc. creative names that fit what you really do. For example, you might use "birthday normalized" for a normalization (in pair trades) that puts both asset prices at 1 at some "start time". You can think of many more examples.
- Simple Rule: Use Goofy Names for concepts you introduce. This is a pay dirt idea. Thank Tukey for it.
- Please label your graphs very carefully --- and most of all clearly. Don't forget box-plots as a way to give a visual summary of a "batch" of numbers.
- Stay aware of the distinction between the parameters of a model, and the estimates of the parameters. We all get sloppy about this from time to time and we can usually get by with it, but its a danger. Estimates depend on chance.
- Final note, your old professor has limited brain cells. You have to explain things very clearly or he will be confused. Clear definitions! Clear objectives! Good Notation! Well labeled graphs! These make his life so much easier.
I earnestly look forward to the Presentations, Day Two!
Sidebar: Two Risk Measure in One Color Scatter Plot
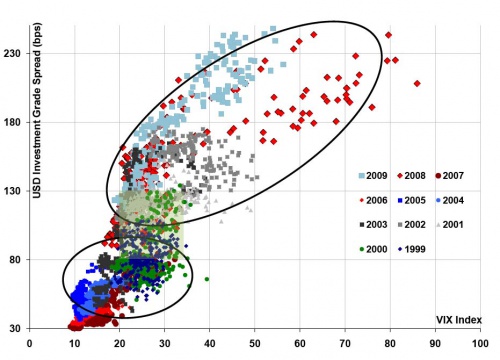
It think this is a great graph. It shows very clearly how the Corporate/Government Spread and the VIX are highly associated --- I won't say correlated because there is no model of "correlation" implied. Still, we have a scatter plot that tells a good story. Moreover, the story is helped out with nice color. [borrowed from a nice piece at ZH]
Sidebar: More Bankers Make for Better Central Banks?
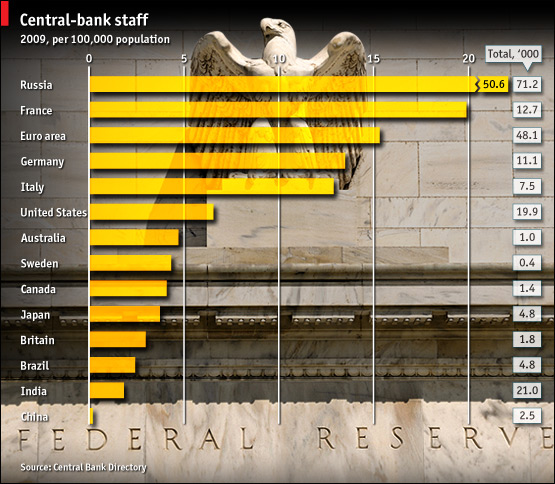
This graphic from the Economist (12/4/2009) gives the number of central bank staff per 100,000 citizens (and on the right side, the total number of staff). China's numbers are at the bottom; Russia's are at the top. Does this mean that ceasing to be a Communist country greatly increases the number of central bankers per capita? Still, Russia has 15 times more central bank staffers in total than Japan. Perhaps the puzzle is that "central bankers" do different things in different countries. BTW, what percentage of Chinese have a credit card? or a checking account? What will be the percentage in 10 years?
Day 24: Let the Presentations Begin!
For 2 December 2009
Please be especially timely today. We need to make sure that everyone has a full allocation of time and that we stay closely on schedule. These presentations are the 'money ball' of the course, and historically they have been quite informative.
Future returns may vary -- but I hope not, yet!
See you all at 1:30 sharp when the first presenter (who arrives a 1:22pm!) will already be ready to begin.
Day 23: Putting the Pieces Together
For 30 November 2009
Today we will have completed just under two dozen lectures, and this is a very modest number given our goal of dealing honestly with one of the central factors of economic life --- the returns on financial assets.
Our plan for the day is to (1) review the stylized facts that we have verified from our own analyses --- and add a few new twists (2) review our models with a focus on where they add insight and value, and finally (3) look at a few ways these can inform the design of interesting projects. In particular, we'll look at the interesting distinction between univariate, multivariate, and ordered univariate strategies. Variations on these methods can be applied to almost any basic project idea.
I'll also add a word or two about the use of confidence intervals and suggest a new technique --- bootstrapping ---which you can use to get confidence intervals (of a sort) for the return on a trading strategy. The method is not perfect, but it definitely has its charms.
I'll also ring the bell again about the importance of data cleaning, EDA, and presentation with thoughtful tables and graphs.
Generic Advice about Project Design (and Process Comments)
Certainly read the Final Project Spec Sheet. We've already covered the main points in class. The one I would underscore here is that clear thinking is a key to having an excellent report. You want to make clear assertions and you want to make sure that what you assert is backed up by clear, thoughtful, and thorough research. Even a "simple" theme can lead to a very rich report if it is engaged carefully and completely.
This is an excellent time to ask questions about your project ideas and plans --- even though you have already written out your "one pager" pre-proposals.
Sidebar: Promised Link on "Zero Cost" Portfolios
Naturally, they are not zero cost, or why would we hold anything else, since some of these do indeed have positive expected returns. The arithmetic of returns is a little tricky here. I've made one pass, perhaps you can do better. At least this puts some issues on the table.
Sidebar: 130/30 Strategies
It's been kicking around for ages that one might do better to be 30% short and 130% long. You can find a lot about this idea on the web. JAI has a useful empirical piece that is easily accessible.
Sidebar: Colorful View of Style Returns by Year
American Century has a colorful chart that is worth a few minutes of pondering. They call it a periodic table --- which is a bit of a pun, I hope.
Sidebar: Silver Price Mysteries of the Past --- and Future?
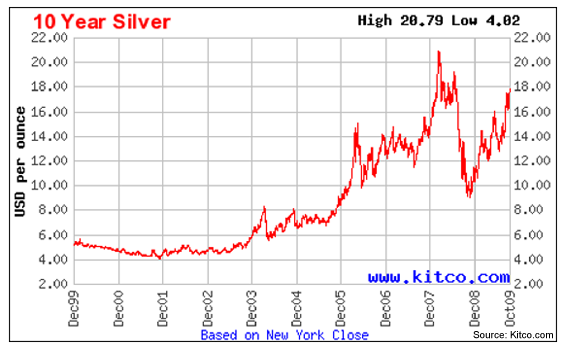
Hard metal 'bugs' are a familiar class of crackpot, but in the dark days of 2002, who could have guessed that the metals would have such a run. Also, the 50% sell off in 2008 seems to have been at least a bit mysterious.
A Priori arguments only take one only so far.
Still, for us, it is therapeutic just to sit and ponder. A 'four bagger' from 2002 to 2007 would have been a pleasing experience for almost anyone. Moreover, a momentum story seems to work here, though --- as a word of caution --- it is good to remember that we are all mostly hypnotized fools when we look at prices and not returns.
Does momentum 'work' for metals? How do you deal with the ambiguity of scale? This is a situation one finds with wild rabbits --- it's easy to seem them, but hard to catch them.
Day 22: Comparing Asset Returns in the Context of Risk
For 25 November 2009
What, no Juggling This Year?
One of the traditional 434 pre-Thanksgiving day tasks is to show how learning to juggle with three balls can be a useful metaphor for learning any complex task.
Also, three ball juggling can be very beautiful --- and magically complex. We won't "cover" it in class, but there is no better way to have four minutes of fun than by watching the Fugly juggler.
Finally, there is our traditional strutting turkey ---- Oh, what he does not know? Sort of reminds me of Bear Stearns's James Cayne going off to his famous bridge tournament.

P.S. There are no office hours today, but you can grab me for a few minutes after class. You may also want to look at an earlier pre-Thanksgiving plan --- though this year we are short for time and will cover some basic business.
Not a Sidebar --- Back to Business!
The plan for today is to look at the notion of risk adjusted returns from soup to nuts. This is a very interesting topic in financial time series, and it has been developed far less systematically than one might have guessed. We'll consider all of the conventional measures, and add a few variations of our own. We'll also look at what one might learn about risks by consideration of post-mortem analyses of crises and crashes.
Not a Sidebar --- Questions about Projects
This is the time for everyone to start discussing the projects --- it's design and execution. I had an email question about the stylistic facts about beta. I'll show how you can do some thinking aloud about the kinds of investigations that beta suggests.
Sidebar: The Risks of Being in Charge of Risk Models
Things do have a way of periodically blowing up, and now banks have found the natural goat -- the guy in charge of the VaR models. (see story). Reminds me of some advice I once gave a class of Wharton undergrads...if you can avoid being in charge of the risk models --- grab the opportunity. The up-side and the down-side are way out of balance.
Sidebar: Volatility? What Volatility Are You Talking About?
When I saw the title of the paper " We Don’t Quite Know What We Are Talking About When We Talk About Volatility" by Daniel G. Goldstein and Nassim Taleb, I was quite excited.
At last, I thought, someone is making the point in print that I have made repeatedly in class. Namely, each time we say "volatility" we point to some parameter in some model, but the model and the parameter can differ from utterance to utterance. This is silly of us, but we all do it.
Goldstein and Taleb get a whiff of this, but not the full scent by any means. Still, you should take a look at their paper. It is a quick read.
Sidebar: PDP a Momentum ETF
PDP is a PowerShare ETF launched in March 2007. The prospectus is one that would make Jessie James uneasy. Unfortunately this asset has not been around long enough to be amenable to much analysis, but the underlying theory of the asset is interesting. It is a momentum story based on a proprietary momentum index --- which would all seem insane --- except that the proprietary index is published independently of PowerShares. Still, the index provider does not seem hesitant to be a promoter of the ETF. Net-net, this does not look like a healthy development.
Sidebar: Nice EDA --- Two Regions Each with Ten Sectors
If you take the 10 sectors of the SP500 and the 10 sectors of the MSCM EAFE you get 10 pairs of numbers, one for each sector. You can then plot these pairs in two dimensions and then ponder the meaning of the 45 degree line. Lo and Behold! It tells you in which of the two regions the given sector is now doing best.
This gives a very interesting snapshot of current market "stages." Note: Points that are near the line are doing about as well in each region, so not much "weight" should be placed on these points. Still, each one of these points deserves a story.
Note: The graph below is for November 2007. By March of 2009 one may have wondered if such returns could ever been seen again. We'll even by December 2009, we do see much happier days. Make sure you understand the structure of this graph --- it's very interesting. You may have a final project that could take advantage of such a plot. All you need is (a) a collection of assets --- say sector returns that (b) come in two flavors --- say the American flavor and the European Flavor. There are many variations.
For a second variation, I I would love to see the dynamic analog of this graph, even for just one sector. The graph I have in mind would plot (x_t, y_t) where, for example x_t is the period t return on the EAFE energy sector and y_t is the period t return on the US energy sector. We could look at 3 month trailing returns and plot a point for each week. It could be a very informative picture.
Sidebar: Stupid Forbes Article
There was a Forbes article last year on exactly on today's topic, and it illustrates just how shallow magazine articles can be. Here we can see the shallowness so easily, the article can cause us no harm. What scares me is not this article, but all the ones that I read where I think that I have learned something new.
Sidebar: Yet Another Black Rock Insane Bandit Fund
The Black Rock Fund Equity Dividend Fund (class A) MDDVX , has a front end charge of 5.25% and a turnover ratio of 2%. If you like this asset, just check the SEC filling, get the holdings, and voi-la 98% replication. This is a dominated asset with 750M under management. They should be ashamed of themselves. Oh, by the way, they have 100bp expense ratio, and --- a Morningstar rating of 4 stars --- which seems --- well, perhaps not right.
What a bizarre situation! Well, small turn over may be virtue in some people's view, but why should anyone pay an annual 100bp for the experience?
Sidebar: Michael Lewis on "The End of Wall Street"
Michael Lewis is famous for his book Liar's Poker which chronicled the goings on at Salomon Brothers during the "Wall Street excesses of the 80's" which were actually pretty tame by contemporary standards.
His current piece is provides a compelling view of the sub-prime development and how if you had a brain and intellectual integrity you could have been on the right side of the trade of the century. It is one of the most riveting pieces of financial journalism that I have read in years.
Sidebar: RiskMetrics on Volatility
The November 2008 research letter from RiskMetrics is worth a look. It's naive in many ways, but it does start some interesting conversations.
Sidebar: World Series of Poker --- For Whom Does It Make Sense to Play?
The other topic that has served us well on the day before Thanksgiving is a look at the logic of playing in the World Series of Poker. We'll not dig into the details this year, but I may outline what I regard as the crux of the problem. On a pure consumption (i.e. entertainment) model, I'd like to play sometime --- but it is hard to swallow taking a bad bet --- and I could be 100s of times "better" and the bet would still be bad. The theoretical question is if it makes sense for anyone --- and if it does my can date is Andy Beal. I may have mentioned Andy Beal before in his capacity as a banker, a role that brought him to my ever-evolving quotes page.
Day 21: Cointegration and Statistical Arbitrage
For 23 November 2009
Final Project --- The Full Details
The project specification has evolved over more than five years of experience, so it is hard to imagine the there is any ambiguity that remains to be squeezed out. Still, I do want to go over it to make sure that everyone knows exactly what is expected --- especially at the level of academic integrity.
Do not forget that your final report is due at NOON on December 16. You must deliver a hard copy to my mailbox in JMHH Suite 400 and you must send an electronic copy to my email. As I mention in the specification, label the electronic copy of your project by your name and mark on the first page if this is "OK to web post" or "Not OK to web post." Both forms of submission are required.
Late reports lose one letter grade per day. This is a huge penalty. Don't even think about it.
You should note on the hard copy and the electronic copy if you are willing to have your report posted on the web for the possible guidance of future 434 students. Without your authorization, your report will not be posted, even if it is the perfect model for a 434 final project report.
***Schedule for the Project Proposal Presentations***
Main Business --- Cointegration and its Application
The plan is to develop the theory of co-integrated series and the application of cointegration to statistical arbitrage. There are many of variations on this theme, but we will be particularly attentive to pairs trading. This class of strategies has bought more than one nice house in Connecticut, but its popularity has repeatedly waxed and waned.
The Puzzle that Started Cointegration --- Spurious Regression
We'll begin with one of my favorite simulations. Simulate two independent random walks, store the values in vectors x and y, regress y on x, and WHAM --- you find a highly significant alpha and beta almost every time. Since we know that x can not tell us anything useful about y, we know we have a spurious regression.
Next, we'll look at the way out of the trap --- testing that the residuals are an I(0) process. If the residuals are an I(0) process we are safe (or at least in no more danger than usual). If the residuals fail to be an I(0) process, then we almost certainly have a garbage regression. It is amazing how often you will see people perform such regressions, not knowing that they have fallen into a well known trap.
We'll look at some resources that add further intuition to this process, including the famous "Drunk and Her Dog" story.
Finally we'll look at some ideas from statistical arbitrage including the idea of a synthetic index and methods of pairs trading. I've started a resource page on pairs trading and I will add to it over time.
Sidebar: News Impact in the Classical Sense (Kobe, Katrina, and Crisis)
How much does news move the markets? This is the question that is addressed by what are called event studies, and there is a nice summary of some of these in a popular article by Robert Shiller, who is well-known for his book Irrational Exuberance.
Oddly, the Kobe scenario was one of "bad news travels slowly." The day one reactions were minor, but after ten days the Nikkei 225 had fallen by more than 8%.
One of Shiller's theses is that market impacts are sometimes the result of news cascades; that is, a drumbeat of follow-up news stories can have more financial impact than the initiating event. Since Katrina was post the publication of Schiller's essay, you might see if Katrina fits into his mold. This won't really make a whole project for the final, but it would be a nice investigation to share with the class.
This theory of news cascade also seems relevant to the financial crisis of 2008. Lehman hits the tank, AIG gets massive, bail out, GM hangs by a thread, etc. etc. It's hard for the market to rally if the world keeps presenting a cascade of bad event that are all related and all on a glide path that takes many months to run.
Sidebar: KMP vs KMR
Kinder Morgan is the largest pipeline management organization in the US. Investors can participate in Kinder Morgan either as limited partners in the MLP with symbol KMP or through another vehicle which is a kind of management company that trades under the symbol KMR.
There is a comment at Morningstar that argues that these assets should trade in "lock step." To me it seems interesting to look at the time series properties of the spread on these two assets. You'll want to think about what is really going on with the two, and you will need to keep in mind that it is particularly awkward to short KMR, i.e. it may be practically impossible. Still, if you get amused by MLPs this is where the fight begins. Other items for the soup? Look out for the differences in distributions --- these should make KMP trail KMR if you just look at price levels. News Check: There maybe reorganizational news about KMR/KMP.
Sidebar: Details on a Blackrock Bandit Fund
People who have been ripped off are understandably thin skinned, so if you have an uncle who has been conned by some retail Merrill Lynch account representative into buying Black Rock Equity Index Fund CIEBX --- or something similar --- you have to be gentle as you coach your uncle out of the jam.
Now would be a good time; the capital gains are not likely to so large that taxes will be a worry.
The objective of the CIEBX fund is "to match the performance of S&P 500 index" and--- provided that they mean the total return of the index holdings rather than just the index price return --- this is a noble goal. Unfortunately, they have a" deferred' front end load of 4.50%, a 0.75% 12b fee and 1.17% expense ratio.
If the "new normal" prevails and a 4% real return becomes your benchmark, then, buying this fund throws away about half of the real return you hope to learn. Buying it is just like giving away half of your future real earnings --- or half of your initial investment.
Buy 100K of this fund, and asymptotically you are guaranteed to get a negligible fraction of what you would get with an investment in an honest SP500 Index Fund such as Fidelity Spartan or Vanguard Admiral. This isn't fancy theory; it's arithmetic. Saving your Uncle from this mistake for just 100K will over time save enough to pay for a big chunk of someone's Wharton education.
Why Do They Do This? It's NUTS!
What I don't understand about Merrill Lynch and Blackrock is why they don't care more about the reputation risk that this kind of larceny at the retail level creates even at the wholesale level. It is transparent that the CIEBX fund is a crass rip-off. Other products are harder to analyze, but, if they are willing to rip you off when you can check exactly how much you have been scammed, then you have expect that they are REALLY ripping you off with their more obscure products.
Do People Learn? Evidently Not
" In 2002, Merrill paid $100 million in fines after regulators found analysts at the firm had recommended stocks they knew to be no good. "(ref)
Still, in every township throughout the land, one can find the friendly well-meaning ML rep, often clueless to his complicity, plugging products that under every possible future scenario will leave his clients with less money than they could have had if they had taken the time to read the prospectus and compare the ML products with the corresponding products from Fidelity or Vanguard.
Small Sidebar: Details on TIPS
There is a piece from GE Asset Advisors that provides a good tutorial on TIPS. It covers the mechanics and discusses both the strategic and tactical uses of TIPS. In a world where there is the possibility of deflation as in 2009Q1, there are some interesting twists on TIPS. Incidentally, they are a favored asset of David Swensen.
Small Sidebar: The Once Noble CREF is No Longer a Hero
Funds like Black Rock Equity Index Fund CIEBX are rapacious in their greed and exploitation of the credulous, but I am almost as irked by CREF.
In the early days, CREF was a genuine leader in providing investment value. Accordingly, they won a place close to the heart of academia. Sadly, in the last ten years, CREF has exploited that trust, and it now charges fees that are indefensible.
The CREF Equity Index Fund expense ratio is 0.50%, and, while this pales in comparison to the Blackrock fees, it is still a stupid price to pay. You can get the same product from Vanguard or Fidelity for less than a third of this price.
The excess spread --- say 35bp to 43bp--- may not look like much, but at retirement time when you have just 400bp to draw down to live one each year, it is at least 8.75% of your income. That is one hell of a tax!
Sidebar: MLPs
I started a little resource page on MLPs, or Master Limited Partnerships. These form a very interesting asset class with attractive non-standard features, including very fat (and pretty stable) dividends and favorable tax treatment. These benefits spring from the tax law view that an MLP is a "wasting asset," but this theory may not apply to many MLPs --- except as a handy tax law fiction.
Sidebar: Performance in Volatility Regimes
"An out-of-sample back test indicates that switching styles according to market regime can be profitable. Specifically, momentum investing during the low-volatility regime and value investing during the high-volatility regime outperforms consistently and to a degree that appears profitable after accounting for transaction costs." ---according to Mebane Faber in a piece at World Beta which has other assertions that would be interesting to test in the pursuit of cheese.
Sidebar: Wisdom and Forecasting
This chart is from the CXO review Philip Tetlock's Expert Political Judgment: How Good is It? How Can We Know? which describes research on the forecasting abilities of political experts. It seems quite plausible that Tetlock's analysis applies to almost any kind of expert view.
Day 20: Rolling Statistics and Momentum Strategies
For 18 November 2009
It never pays to ignore what you know, so any forecast, strategy, VaR level, or performance measure needs to be constantly up-dated as new data arrives. The first part of our plan is to review the tools in S-Plus that make this easy. The main tool is aggregateSeries(). This is a very general tool that makes it convenient to do "rolling anything."
Moving Averages --- Simple Minded, but Not Silly
We'll also look at some of the most ancient tools of time series analysis, the exponential weighted average. This is an all-purpose tool that is often used in combination with other, more sophisticated, time series tools. One of the apparent difficulties in the use of moving averages (simple or exponential) is that one has to pick a "window" size. We'll discuss some ideas for dealing with this problem, including" Foster's Trick." This is something that it would be very worthwhile to explore in a final project.
We'll see how it is used in the MACD, which is reported in many graphical packages, including the free on-line chart service BigCharts.com.
One trend line story that seems to have some non-idiot following is the slope of the 16 or 21 day simple moving average. Again, as a project, you could contemplate testing this. Just thinking of the simplest things first, how about a simple ordered univariate strategy based on this theme?
MACD and Other Price Level Favorites
MACD is goofy in some ways but it has fascinated me for a long time, because it so often looks like "it works." Unfortunately, formal tests with individual equities mostly come back with the verdict: "No extra cheese."
I keep looking for the context where MACD really does pay the rent. My sense is that it has a good chance of working well in currencies, and in style spreads --- say small cap value vs small cap growth. It might also be useful in making guesses about sector rotation. Exploration of one or more of these ideas might make a good project.
Momentum Strategies
Finally, we will look at a resource page on momentum strategies. It has a CitiGroup FX Advisors presentation, and summaries for a few leading academic papers on momentum. The CItiGroup piece is pretty lame by the standards of 434, but it is worth a brief look. If nothing else, it suggests that at least some of the competition is not to be feared.
Sidebar: Tops and Bottoms Identified by Sector Leaders?
A random web wag suggests that at the market tops the leading sector is consumer staples (say as reflected in XLP) and at market bottoms the leading sector is consumer discretionary (say as reflected in XLY). Naturally, this case is built on recent experience, and it does make modest sense. Is it something you'd like to bet on? I can't decide, but it is something that I'll keep in mind.
In the recovery from the 2009 March bottom, the consumer discretionary stocks certainly did well, but it is a matter of checking to see if they out performed technology. Of course, with AAPL you had it both ways, and that has been a marvelous holding so far this year.
One of the things that I find interesting in this analysis is the use of the XLY/XLP ratio. There are lots of other contexts were such an idea my be just what one needs to stir the "missing non-linearity" it to the model. This ratio was particularly jammed around in 2009 because of the wild swings in oil price.
There is a related theory that says that of all the goodies out there that might be counted on for reliable trending --- retail is the king. If you are looking for leading indicators, the retail index RLX may be a good shot.
Sidebar: Markets and Mindshare
The size of the world's bond market (55T?) and world's equity market (45T?) are comparable in a "Fermi sense." Historically, equities have clobbered bonds. Moreover, bonds are hardly risk free. For example, the bonds of the Weimar Republic became worthless, but the stocks did not. On a less dramatic scale, you can have a very rocky road with even a 30 year US Treasury --- a 1% rise in interest rates can cost you perhaps 25%, depending on the initial interest rate. So, why are there so many people, businesses, and governments who are happy to own bonds? How does this fit with our "counterparty theory" of strategic investing.
Sidebar: Stylistic Features of SP500 Returns
Wilhelmsson (2006) also deserves some class time. One nice feature of the paper is a break-down 1995-2000 and 2000-2005 of the fundamental features of the SP500 returns. These are very useful for calibration of one's intuition about returns --- and hence for "Fermi" calculations. This is his Table 3, and it is not his main message, of course. The main message is that it pays to deal with kurtosis (fat tails), but may not pay to deal with skewness (asymmetry about zero). One of the take-aways is that GARCH(1,1) driven by shocks that have the t-distribution is the best of breed given method of evaluation. We may not buy that method, but the conclusion may still hold up for us.
Sidebar: Be Short Vol and Expect Sad Days
Straddles, Nick Leeson, and the collapse of Barrings Ban
Sidebar: Fact or Artifact
There is a Seeking Alpha piece that reports on weekly returns of SP sectors versus the weekly returns on oil. They get that energy is positive (well, duh!) and everything else is negative --- with XLP being the most negative. Do you expect this relationship to hold up over time, or is it simply an artifact of the study period (which ended in October 2007). You could extend this analysis as the start of a final project.
Day 19: Comparing GARCH Family Members
For 16 November 2009
Now that we have a substantial family of GARCH models, how should we choose between them? The plan is to first consider some structural features, especially the connection to the Wold representation and our old bête noire --- stationarity.
One useful way to compare the many animals in the Garch Zoo is by looking at a plot called the "news impact curve." Given two models we first find appropriate values for the parameters of the models, say by fitting both to the same data. When then fix those coefficients and consider the the conditional variance as a function of the innovation epsilon_ t.
This function tells us how the two models will differ in the importance that they attach to a given shock. This measure is not perfect, since it speaks to just the impact of one shock. Still, it seems to be informative, and it is easy to implement (see e.g. S-Code Ex.)
The picture we get will give some intuition about which models "care" most about a negative shock versus a positive shock. Still, the pictures are not perfect, since it is not always easy to say which parameters values are "comparable" when one looks at radically different models. One way to make progress is to fit both models to the same data. Unfortunately, this begs another question; namely, the question of model specification.
Next, we consider non-normal drivers of the GARCH model. This is an important issue that makes the GARCH model much better than it would be otherwise. Still, the trick is old, going back to Bollerslev (1986).
Finally, we dig into a paper of Hansen and Lund which compares some 330 GARCH models. This is a heroic effort which we will be delighted to cover only from the summaries. Still, there is room to note a fundamental philosophical point. To compare one needs a criterion. How is one to choose among the potential criteria? My favorite is fitness for use. This is by far the most sensible criterion, but it does put a lot of questions to the modeler --- most of which do not have comfortable
Caveat
I tend to "sell" the take-away from Hansen and Lund to be that "you don't need to look much further than GARCH(1,1), or perhaps EGARC(1,1)."
I do believe this, but it is a little sophistic to argue this just from exercises like that done by Hansen and Lund. The problem is the criteria for judging the models. Hansen and Lund use a bundle of them, but a eight inadequate measures are not all that much better than one.
Also, the idea of ranking a zillion pretty similar models and then looking at the ranks --- well, that is clever, but it is also a bit sophistic. We'll also look at the paper of Wilhamsesson for a bit more perspective.
Alternative Features of Merit
There is anther principle that I like. You could call it simulated verisimilitude. You fit the model, then simulate data from the model, then do EDA on your simulated series and your original data. If the EDA (and other logical) comparisons are not pretty close, then you have good reason to be unsatisfied with your model.
It is amazing to me how seldom this method is used by model builders in operations research, scheduling, logistics, transportation, etc. Those guys very often use models that have very little relation to the stylized facts of their business. In financial time series, we do at least have this part of the drill down pretty clearly.
Last Homework! This homework provides experience using a GARCH model to engage something that is of bottom line interest --- the relationship of risk and reward. As it is presented, it is reasonably straightforward. Nevertheless,t if you have time, you can use it to do a little exploring for your final project. It also provides a reminder of the very on-going importance of basic regression and EDA studies.
Approaching the End Game
On Monday the 23rd the last homework comes in, then Wednesday the 19th and Monday the 24th will be "regular days." On Wednesday December 2, we will have our first round of "Final Project Proposals." The second and third rounds will be on the 7st and 9th of December, our last days of class. The final projects themselves will be due on December 16 at noon.
Sidebar: Roll of Subjective Judgment in Risk Models
The NY Times article "In Modeling Risk, The Human Factor was Left out" adds a bit to our discussion of VaR models, especially those models that ignore "known but unobserved risks" such as the historical "peso problem" or the more recent "agency problems" of CDOs.
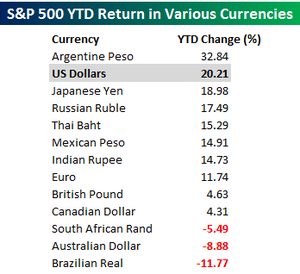
Sidebar: Managing Multiple Currencies
There is an old interview with George Soros where he points out that money management is easier if you only have to be concerned with one currency. The returns of 2009 (to November) illustrate this worry nicely. It also shows why the super returns that US investors made on EM stocks were not so super in local currency.
Day 18: The "Leverage Effect" and the GARCH ZOO
For 11 November 2009
The GARCH model takes a major step toward a realistic statistical view of the noise in asset return series. Still, it is not perfect. In particular, the plain vanilla GARCH model responds symmetrically to either a negative or a positive shock. Historically, it is the case that a large negative shock has a more substantial impact on subsequent volatility than does a positive shock. A plain vanilla GARCH model cannot capture this phenomenon.
Fisher Black (partner with Myron Scholes in the Black-Scholes formula) called this phenomenon of asymmetry the "leverage effect" and the name has stuck. Black gave an interpretation of this empirical phenomenon from the point of view of the firm's debt to equity ratio --- one traditional measure of leverage. Since observed volatility is not well explained by debt to equity (except in certain extremes), the name "leverage effect" does not seem to be a good one. Nevertheless, the effect is real. When you take any of the models that test for a "leverage effect" you will be likely to find that it is significant.
Black's Leverage and Modigliani-Miller
Black's leverage story may seem to contradict the Modigliani-Miller Theorem. If it did, it would not particularly bother me. Still the problem is worth pondering. I'll argue the view that there is no contradiction because the Modigliani-Miller assertion is about value, and Black's leverage story is about volatility. Now volatility does effect value, but subtlety --- through volatility drag from our perspective, but surely not enough to make us regard the MMT and Fisher's leverage effect as contradictory.
Cultural Note: Franco Modigliani --- an Italian-American --- pronounced the "dig" in his name and won the Nobel prize in 1985. Amedeo Modigliani --- an Italian painter --- pronounced gli as "li" in the Italian fashion and lived a brief life that was textbook Bohemian. [Note: This note may be all wrong. i'm still checking!]
We'll then look at the models that attempt to cope with the so-called leverage effect. Most of our attention will be given to Nelson's EGARCH model, or exponential GARCH model. This is the "next step" model that has rather reasonably stood the test of time. It is definitely useful by both academic and practitioners. It definitely has its uses, though it does not provide nearly as big an increment to our toolkit as GARCH itself.
After EGARCH there were many other models that attempted to deal with this or that stylistic fact that is not well modeled by GARCH. Naturally, one eventually faces a certain law of diminishing returns. Still, it pays to know about at least a few of these.
We'll also look at some relevant examples in S-Plus. It does indeed turn out that when you fit a model like EGARCH to the returns of an individual stock, you are very likely to get a significant value for the leverage parameter.
It's not easy to say what this really means to us in an investment context, but it is certainly worth thinking about.
Leverage Effect not a Leverage Effect
For year's I have argued that Black's interpretation of the "leverage effect" as a "leverage effect' didn't really make sense, and II figured that everybody knew this.
Turns out that there was still a paper to be written, so if you want (substantially) more than what comes with our Fermi calculations, you can look at an informative 2000 paper of Figelwski and Wang.
Sidebar: Risk and Reward
There is a piece on the risk-reward trade-off posted at CXO that is worth a quick look. Some parts of the piece are confusing, but it puts interesting questions into play. The introductory story should make sense to you, and, if you get interested the original paper is worth a look.
The big question is "Do you get compensated for taking incremental risks --- or is it the case that for any given asset incremental risk (as measured by "volatility") is an a priori bad thing?"
In the classical stocks versus bonds story, we see historically a very reassuring compensation for risk taking, but through time and within one asset class the story comes close to reversing itself. You'll get to explore this in HW9.
Also, from CXO there is a nice list of assertions relating volatility and excess return. This is a good list to think about as you ponder your final project, which we will start discussing today.
Sidebar: TIPS Yields in a Crisis
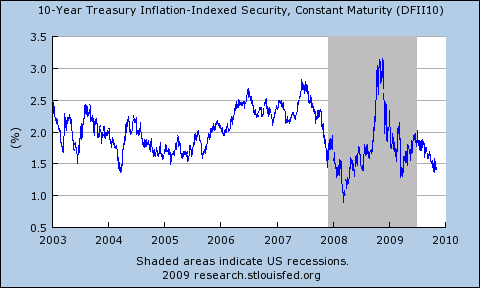
Krugman's blog story about this argues that the spike in TIP yields post Lehman's bankruptcy was due to liquidity. Keep in mind that vanilla treasuries yields were dropping during this time as part of the traditional flight to quality. I can't quite get that TIPS lack 'quality' --- but perhaps in a mad-rush-for-the-doors way they do. (For an older but more nuanced view of TIPS and inflation see the essay of Evan Koenig.)
Anyway, the next time that it looks like financial Armageddon, you might (1) first slam into Treasuries, (2) swap over to TIPS after about 5 months, then (3) after about 5 more months sell your TIPs and go long equities ---- first favoring the most volatile assets (emerging market, small cap growth, financials) then moving to large cap growth and energy.
History may not repeat itself, but at least this gives you a baseline to squirm around.
For an simpler "TIPS rule" how about this? It's hard to be disappointed if you buy TIPS with real yield above 3% (and you should be pretty happy with real yields above 2.5%).
Sidebar: The Pollyanna Fit
This is a variation on a point made in the Granger article that we discussed in class. Take any old time series of returns and replace all of the 'big moves' with 'something more tame." The do you favorite fit and see if you get a wad of extra significance. Here are some things to ponder:
- Can this give you insight on the "way to bet' in normal times?
- Do the 'big move days" appear like a Poisson process, or do they have more clumping?
- What are good candidates for replacing the data on the 'big move days"? One candidate is the general mean.
- If you use a Pollyanna fit to organize your bets, what are your risks? The thesis is that you can 'break even' on the big move days --- which you give up on modeling. This can be true or false.
Sidebar: MERFX --- Good Theme, Bad Expense Ratio
"The fund normally invests at least 80% of assets in the equity securities of companies which are involved in publicly announced mergers, takeovers, tender offers, leveraged buyouts, spin-offs, liquidations and other corporate reorganizations."
This is perhaps not a bad idea if one is after a decent Sharpe ratio. You have less than market risk (only losing 3% or so in the annus horribilis 2008) and an expected return of perhaps 8% to 10%. You can also back test the theme with simple rules, and it looks like there is a little cheese here. Still, the good folks at the Merger Fund don't work for free, they snack on an expense ratio of 1.45%. If you like the idea, why not do some reverse engineering. It seems a terrible pity to waste 145 basis points.
The classic way to play this theme is to buy the company being acquired and sell short the company doing the buying. This stirs a lot of leverage into the pot, and when things are 'normal' there is useful risk-adjusted cheese in this game.
Pre-class Note: VIX Switched Regressions
After class on Wednesday in conversation with Alex, I got a little more clear about the easiest way to incorporate VIX-based switching into time series regressions. There are lots of ways to use the general idea (with VIX levels or style "moves" etc). These tricks are a natural way to follow up on Granger's suggestion to look for nonlinearities. I also think these models offer useful ways to hunt for "cheese" --- or, more humbly, projects.
Day 17: ARCH and GARCH
For 9 November 2009
The ARIMA models underpin a large part of the theory of time series, but they have an Achilles heel when applied to financial time series --- the conditional variances of ARIMA models do not change as time changes.
For financial time series, this is in violent contradiction to reality.
One of the most fundamental stylistic facts of asset returns is that there is "volatility clumping" --- periods of high volatility tend to be followed by periods of high volatility, and periods of low volatility tend to be followed by to be followed by periods of low volatility.
The ARCH and GARCH models were introduced to remedy this situation, and they have led to models that are much more representative of financial reality. Our plan will be to develop these models as they evolved, first looking at why they are really needed. We'll also look at the tools in S-Plus for handling GARCH models, either in simulation or in fitting.
Finally, we'll discuss some original sources, notably a review article by Robert Engle called GARCH 101. The notation used in this piece is no longer the standard notation, and some bits are best taken with a grain of salt. In particular, given what we know now, Engle's discussion VaR is "optimistic" to say the very least. Still the piece is instructive.
Another paper we might discuss briefly is Engle's paper with Andrew Patton "What Good is a Volatility Model?" Ironically, this paper has the "tell" that I have mentioned in class, namely it uses the Dow (OMG!) as its illustrative price series. I don't know what motivated this choice, and I find it a little less serious than I would have hoped.
A positive feature of the paper is that it gives a brief list of "stylized facts," a very important notion to which we will start paying more systematic attention.
Sidebar: "Will We See a January Effect This Year?"
Mark Hubert had a piece on this in 2008 and it may be worth thinking about for this year. His thesis was that the January Effect (i.e. bigger small cap returns than big cap returns from 12/15 to 1/15) is more pronounce in years where the market has been strong going into December.
Sidebar: TIPS Spread and Temporary Insanity of November 2008
"TIPS yields indicate investors are betting consumer prices will fall. Five-year TIPS yielded 0.31 percentage points more than Treasuries of similar maturity this week." --- Bloomberg 11/1/2008
Yes, this was a very strange situation and it did not last. There were a few months of YoY deflation, but the TIPs real yield did normalize.
Sidebar: TrimTabs, Money Flows, and "Bottoms"
"When public companies are net buyers while individuals are heavy net sellers, the market is making a bottom": This is an interesting assertion of the TrimTabs Liquidity Theory. The irksome part of this little observation is that "making a bottom" can take a lot of time and money. From the publication of this piece, the bottom did not present itself for five more very long months --- and almost as much value destruction as had been booked from November 2007 (the previous top) to November 2008 (the date of the quote).
Sidebar: Mean Reversion vs Momentum
Essentially every quantitative strategy depends on a view that is either "trend following" --- that is a momentum strategy , or "trend reversal" --- that is mean reversion strategy.
Between the two, there is always a finely pitched battle. It seems to me that the momentum story has more reported successes. Still, there are situations where the mean reversion case can be made. One of these was mentioned in the Granger article covered last time.
As a variation on the strategy reviewed there, take any set of say 100 stocks. Now on each day, buy the 3 that are off the most at the close, and hold these stocks for 10 days. Now, compare this strategy to the comparable market buy-and-hold strategy. How do you do? Here, by the way, you might take your transaction cost to be 5 basis points on each leg of the trade. This is realistic if your trades are small enough to avoid market impact cost but large enough so that you are essentially paying one bid-ask spread for a round trip.
The biggest potential "bug" in such a study is that your real-world "buy on close" price may have some slippage from the "print" close that you find in the historical data.
Day 16: Switching Regressions, Non-Linearity, Forecastability, and Cost-Benefits of Subjectivity --- and, oh, Tells!
For 4 November 2009
We have to look a bit at some of the code for doing time series regression since we did not close this loop last time. Still, our main goal is to review a classic discussion paper by Clive Grainger, "Forecasting Stock Market Prices: Lessons for Forecasters."
Grainger shared the 2003 Nobel Prize in economics and his contributions find few equals in the world of econometrics. Granger's old paper has benefits for us even though at this point the it is rather dated. One benefit is that it can be 95% understood at the level of Stat 434. Second, and more persuasively, it suggests some potentially useful ideas that even now have not fully explored.
As a caveat, Grainger's introductory comments on martingales and the EMH (and a few other things) are way off the mark. For example, if asset prices were martingales as the introduction considers, then only risk-seeking gamblers would invest.That is just silly.
This part of t he paper can be fixed with just a small correction. For example, one can use a I mentioned alternative earlier. Specifically, the ratio of an asset price to the market price may be more feasibly viewed as a supermartingale which you recall is a "bad" game. This makes the assertion logical. Unfortunately, it still remains untestable because even the remote possibility of a very bad outcome can upset the whole apple cart.
At other places in the paper, we have to be concerned about data quality, or stationarity, or data relevance. For example, one of the papers that Granger discusses uses market returns back to 1896. For me, this is just too far past the "use by date".
Similarly, at one place Granger looks at transaction costs of 0.5% or even 1%. Nowadays, this is a silly level of transaction costs for the assets in question --- except in the remotely relevant situation of market impact costs. In more common (but still special) situations, you are even paid to trade; that is, you make money trading, even if you just break even on the trades. This sounds weird, but I will explain. It is a little bit like being a shill in a poker game. Sidebar: The Wiki piece on shills looks only at the negative side. There really is a positive side too!
Nevertheless, if anyone is looking for advice about how to have better luck forecasting asset returns, Grainger's piece is a very sensible place to begin... for more, look at the citations.\
Note: Citation Searches
When you find an article that you like (or even one you don't like), you can find more recent articles that follow up on it by doing a citation search. This is typically a much more efficient way to find relevant research than just by looking up a topic. In particular, if you look up a topic that is too broad --- like forecasting --- almost no one can thread his way through the forest. Citation searches are a very powerful research trick.
Note: S-Plus Tools For Rolling Regressions
We may also discuss the tools that are available in S-Plus for dealing with dynamic regression. Rolling regressions and weighted rolling regressions are a staple in many of the Stat 434 final projects, but at this stage you can probably learn everything that you might need about these tools just by working through the code box example.
Note: Risk Free Rates
For a CAPM style modeling exercise, one needs "risk free rate." Exactly which rate one might choose is open to debate, but 30 day treasury yields are usually appropriate. When you put any rate into the regression you will naturally have to make sure you are comparing apples and apples --- i.e. daily stock returns and daily risk free returns. To convert treasury yields to daily yields, you can use the conventional 360 day year. For data resources you have several options.
Sidebar: The Old Bellwether Idea --- It's now Now the Apple Tell
For the longest time people would look to GM (LOL!) and later IBM as "bellwether" indicators of the market. That is, these were viewed as leading indicators of the whole market. More recently Apple, Google, RIM are the new "bellwethers" --- at least for the tech sector. I
Is this baloney, or is it cheese? BTW, "cheese" is a 434 term of art that stands for "excess returns." This friendly term has not been used much this year, perhaps as an apology for past year abuses.
Sidebar: Uses of Subjective Information
In science and engineering there is a tradition of working hard to minimize subjective content of models and analyses --- but even there one has to admit that many design choices are based on subjective information. There is a phenomenon in economics called "physics envy" and this is one of sources of pressure for analysts to minimize subjective input into financial and economic models. The downsize is that this leads to more and more weight being place on historical observations. As we know from the discussion of the Peso Problem, such back-looking empirical estimates may ignore some serious economic facts.
This brings us to the thorny issue of subjective input in to models like those that are used in VaR calculations. It is clear to me that subjective input would have provided at least some improvement on the VaR models that have blown up over the last year. If one does advocate subjective input, it's a good idea to give a periodic review of the cognitive biases which can be as real --- and as dangerous --- as the "path-focused objective myopia" which one might hope to ameliorate with the inclusion of at least some explicit subjective inputs.
Sidebar: Regarding CAPM and Other Puzzle --- What Changes a Mind?
“Children do eventually renounce their faith in Santa Claus; once popular political leaders do fall into disfavor…Even scientists sometimes change their views….No one, certainly not the authors, would argue that new evidence or attacks on old evidence can never produce change. Our contention has simply been that generally there will be less change than would be demanded by logical or normative standards or that changes will occur more slowly than would result from an unbiased view of the accumulated evidence.” ---Nisbett and Ross (1980), quoted by Hong and Stein (2003).
Incidentally, this quote is consistent with the notion of confirmation bias which asserts that a person holding a view is more likely to be attentive to evidence that supports his view than evidence that does not. Confirmation bias is a feature of human psychology that has been demonstrated in a great variety of experiments.
Vestigial Sidebar: Volatility Drag
We may also revisit the formula for volatility drag, though I think this is well-known to you now. The spin I do not want you t miss is that volatility drag may offer some explanation of why the "2x" leverage funds do not provide returns that are as large as one might have expected given the returns of the underlying asset.
HW6 Questions and Answers
- EDA means "Exploratory Data Analysis"
- Yes, a t-distribution with one degree of freedom is the same as a Cauchy distribution.
- Does location and scale disturb the interpretation of a qqplot? That is a puzzle for you to contemplate.
- RYTNX is a mutual fund, not a stock. The returns are in WRDS. This series is longer than the 2x ETF alternatives.
- Remember Always: Google is an extension of your MIND. It will answer many questions --- including these.
- Logic of ADF test. In the simpler DF test you are testing only the hypothesis that the AR(1) coefficient phi_1 is equal to one. In the ADF test, you are still just testing this hypothesis but you allow for the possibility that the model is more complicated than the plain vanilla AR(1). Under the null hypothesis --- where you are looking at something that is random walk like --- the model is a RW to which has been added a stationary (or I(0) ) process. For details, look at the model specification in ZW.
- Small point. Any series with drift is a non-stationary series --- specifically having a drift implies that the means are not constant as they must be for a stationary series. We we do an ADF test that "allows for trend", we are really saying ---- ok, remove any trend then tell me, is the hypothesis that I am now looking at a RW wildly improbable?
Day 15: Time Series Regression and Applications to CAPM
For 2 November 2009
The plan mostly focuses on the natural extension of ordinary least squares regression (OLS) to financial time series. Still, there are new topics, such as the likelihood ratio test and the AIC criterion. We'll particularly look at AIC, AIC weights, and the way to use these to combine forecasts.
We'll look at the nuances of the model and its associated tests. We may also cover a MSFT/CAPM example that is bundled with Finmetrics, but you can just as well look at this by yourself.
One of the most famous models that fits into this context is the 1992 Fama-French Three Factor model. This is the model which for many (but not all) signaled the "death of the CAPM." Parallel Mark Twain's line, the rumors of the death of CAPM may have been greatly exaggerated. Still, the true believers are starting to face a sea of troubles that are almost as tough as the ones face by those who preferred had a hard time with heliocentrism, but comparably sure experiments are much harder to come by.
The Wikipedia article on Fama describes the three factor model, and it also has useful links, including one to the original FF92 paper and a good humored one to a Dartmouth humor magazine.
If you do look at the original lFF92 article you will see that there is a fair amount of technology there which we have not engaged. Still, with the tools we do have you can tell very similar stories. The basic tale is pretty robust. It's time to list it as one of our "stylistic facts."
Maximum Likelihood and the ML Ratio Test
Basically all the test that you have seen in all of the statistics courses that you have taken are obtained by on general method, and they are all what is called a maximum likelihood ratio test.
The computations behind these tests are a basic part of other statistics courses, but we still to well to review a bit of this theory. In particular, it gives us the chance to nail down the very fundamental notion of the likelihood. This is critical for maximum likelihood estimation, for the likelihood ratio test, and for other cool stuff like the AIC, which comes up next.
Akaike's Information Criterion and Model Averaging
The Akaike Information Criterion (or AIC) is perhaps the most widely applied criterion for model selection.
For my own account, I am not a huge fan of AIC. The main problem is that in many cases one assumes at least as much going in as one hopes to infer coming out. In pure model selection there may be some net gain in most cases, but, since there can be loss in some cases, it is not clear that one wins over all.
Still, the AIC is out there, and it mostly seems to point in the right direction. It's probably worth consideration in most contexts, provided that one does not get too carried away.
Model Averaging: A Practical Alternative to Model Selection
If you are interested in using your model as a forecast, you may be able to side-step the problem of model selection. Rather than simply chose model A or model B to make your forecasts, you can instead consider an appropriate average of the forecasts given by the two (or more models).
Foster's Trick For Model Averaging
There are many rules one can pose for averaging the forecasts given by a set of models. You could just take the simple average, or you could take a weighted average where the more accurate model is given a larger weight. A still more principled idea that I learned from Dean Foster is to use regression. Here one takes the forecasts of the models and regresses the observed returns against these forecasts. One can then use the regression coefficients as "weights" for the combined model. Here we use the quoted because the weights can be negative and need not add up to one, so this method is not strictly an averaging method.
Naturally this idea must be combined with good sense. The forecasts given by your original models are quite likely to be highly correlated, so this regression problem can be ill-conditioned. My advice would be to consider this as a exploratory tool. There is no reason at all why you cannot stir in your own judgment.
The "Best" Criterion --- Fitness for Use
The model that is best is the one that "works" best for you. Ironically, this criterion is not often discussed. I have written a bit about this, and eventually I will write more. The whole notion of a model is one that deserves a richer --- and more philosophical --- view that is common in statistics courses.
Sidebar: "120/20 Good Buddy"
Among the strategies that now have the public ear are the 120-20 strategies ---- leverage up 20% on the long side and off-set this leverage by going short for an amount of 20%.
Naturally, such a strategy would be nuts --- unless you could pick winners for at least part of your up-position and pick mostly under-performers for your short position. As a retail investor, you would also face an 8% margin cost headwind on the 20% that you are leveraged and the headwind of any dividends to be paid on the downside.
Thus, for an individual investor replication of a 120-20 strategy is a non-starter.
As an institutional investor, your long position will cost LIBOR and a bit and your short position will pay LIBOR minus a bit, so for professionals the whole game becomes modestly feasible.
Thus, professionals have the opportunity to let you in on this game --- for a modest fee, of course. This is a good trick all by itself, but the 120/20 pitch has a ready listening. You can look at some of the recent pitches.
My own view is that these retail issues are not good deals, but I am open to arguments on the question. If you are looking for a final project, you might want to consider a project that plays off of these funds.
Sidebar: Unconditional Variance of the AR(2) Model
Alex Goldstein has kindly written up a derivation of the unconditional variance of the AR(2) model. His trick is to use a variation on the Yule-Walker equations, but not the Yule-Walker equations themselves. The calculation is actually not-to-bad, and it is certainly easier than the Wold decomposition approach that I suggested. Still, even this method shows that one does not want to look for a formula for the unconditional variance for the AR(3) model.
Sidebar: CRB and Dollar Index
Here the picture looks compelling (CRB up, Dollar Index down) but we know that it is easy to ge hypnotized by price charts. Nevertheless, there is some logic to this if commodities are indeed "priced" according to some international basket of currencies. What needs thinking through is that the dominant asset in the CRB is oil and at least in principle it is priced in dollars. Gold would be another story.
Sidebar: VXX and Going Long Volatility
VXX is an ETN that is supposed to track a perpetual 30 day VIX futures contract, which is something that exists only in theory. Naturally there are fees, expenses, and the possibility of incompetent tracking. Still, if you don't have a futures account, or can't stand the nose bleed of trading futures, then this still gives you a way to 'express your view' about implied volatility. The contract is relatively new, but it is sponsored by Barclays --- one of the ETF/ETN good guys --- so it may turn out to be a useful trading asset.
Sidebar: Distressed Debt (Icahn and CIT?)

Day 14: VaR --- The Sad Story
For 28 October 2009
The first (and main) part of the plan today is to look at the most widely used tool for expressing risk exposures:VaR, --- or Value at Risk.
As I said even before the 2007 course blog: "There is much wrong with the way VaR is used and calculated --- even in the most enlightened firms. Some implementations are close to (1) a hoax or (2) at least naively self-delusional. "
Still, VAR used almost universally. Moreover, the vast majority of implementers are sincere in their belief they have done their best.
The people I hold responsible for the destruction caused by VAR are those who said, "Everyone else has good Value at Risk measures. Either you guys come up with a system that works, or I'll get someone who can." In such an organizational situation, you are guaranteed to get bogus analyses --- all of which will agree very comfortably agree with all the other delusional models. This is sad, but very human --- the mechanism of social proof is as universal as any phenomenon one can imagine.
Again, humbly quoting myself from the 2007 blog, "If one could simply bet against run-of-the-mill VaR estimates, one would not need to look for other investments. This would be ... a veritable paradise of Black Swans, vastly more lucrative than those (too rare) Black Swans that stingy options traders occasionally provide."
Why, Oh Why, Is this So?
There are two virtually insurmountable problems with VaR as it is calculated in most firms. These are the "Peso Problem" and the "everything is correlated at the extremes problem. " There is also a less overtly dangerous but still unavoidable problem I call "Tukey's Biased Estimate of Variance."
The "Peso Problem" is a standard part of economic lore ---- but it is steadfastly ignored by essentially ALL VaR models. The point is that "observed risk" (say as measured by historical return standard deviation) and real risk (say as set by the smartest book makers) are often wildly different. There are indeed "infinite Sharpe ratio" investments that are (at most) only mediocre bets.
The "correlation problem" has also been widely understood for a long time. It was one of the forces that led to the demise of LTCM. It was one of the forces in Niederhoffer's first blow up after the Asian Crisis of 1994. Still, my favorite example actually goes back to the great flood of 1927, and I'll tell that story in class.
Despite the long history , the" correlation problem" is ignored in 99.9% of VaR models.
Finally, how about Tukey's Estimate? I'll elaborate in class, but --- it's ignored. Why? Because it would force everyone to bring down their leverage. Well, since the fall of 2008, we have the strong sense that bringing down the leverage early is sometimes the right thing to do. The VIX, the LIBOR-OIS spread, and other indicators told us what to do, but VaR was the last to speak --- and it was too late.
John Tukey understood all of this, even before the ideas came into play in a financial context.
With a barrel-chested sotto voce rumble, he would say, "The variability that you have seen is always an under estimate of the true variability." In our context, where volatility and variability are cognates, Tukey is on one side, and the world's VaR models are on the other.
My money is on Tukey.
Still, many firms are getting better at VaR, and we just need to have evolution play its role. Though many individuals in many firms will kick and scream, the big firms with the best VaR models (and other risk controls) will be survivors. As the "subprime" story played itself out, we found that many firms had VaR estimates that were pure garbage. It seems inevitable that some measure like VaR will always be with us --- and it seems that sometime again in the future it will greatly fail us.
Peso, Correlation, and Tukey are too much headwind for anything.
Extreme Value Distributions --- Use at Extreme Risk
On the more technical side, we'll look at extreme value theory, which is one of the tools that theoreticians always seem to want to trot out when there is a discussion of big market moves. The mathematics of the extreme value distributions is interesting, but for several reasons extreme value theory doesn't deal with the reality of extreme market moves.
We'll discuss the Gumbel (or Fisher-Tippet) distribution in class. It comes out of a beautiful limit theorem, and it is the leading example of what are know as extreme value distributions. Sadly --- and in stark contrast to the Central Limit Theorems --- there is a major disconnect with any level of honest practice.
You will see from a homework problem that the convergence is excruciatingly slow even in the ideal case of normally distributed random variables. There are people who have advocated the use of this distribution in financial practice. It has even been used as part of the Tokyo building code. These applications are bogus, bogus, bogus.
Still, extreme value distributions are worth learning about. There probably are special contexts where they are applicable, and they have a undeniable charm. Also, they are part of the common language, and any time "extreme" events are discussed, they are likely to be drawn into the conversation. When this happens, be prepared to be skeptical.
As a sidebar, this also give us a chance to discuss the some core ideas of simulation, including the rejection method and the inverse probability transform method.
More on Risk-Adjusted Returns
At some point in life every one should read what Bill Sharpe has to say about his famous ratio..
Sidebar: "Is RSP a Stinker?"
Just as a side note, you might want to think about a project that plays RSP versus MDY. These are assets with different designs, but which are very highly correlated. RSP has a bigger expense ratio, so it may be that the portfolio of long MDY short RSP can have a sweet Sharpe ratio --- small mu, but microscopic sigma.
Sidebar: Sales of Safes Spike in Crisis Week 10/22/2008
The CEO of Wal-Mart gets to see secrets of human behavior that most can never see. In a CNBC interview on 10/22/2008 Lee Scott observed that his stores saw a "run on safes" during the weeks of the October 2008 financial crisis.
Sidebar: Remembering: October 30, 1961
Tsar Bomba was detonated at 11:32 a.m. on October 30th, 1961 over Novaya Zemlya Island in the Arctic Sea. With a lead tamper, the bomb had a yield of 50-60 Megatons, more than ten times the explosive force of all of the explosives used in the Second World War --- including the atomic bombs of Hiroshima and Nagasaki. Tsar Bomba was a very clean bomb, as essentially all of the fallout would come to rest on the USSR. With a more "traditional" design using uranium tamper, the yield would have been expected to be100 megatons. The Tsar Bomba is the most powerful bomb to be detonated on Earth --- so far.
Day 13: Stationarity and Unit Root Tests

For 26 October 2009
Stationarity is the assumption that gives us a link to the past. Without "belief" in stationarity (or some surrogate), we have (almost) no way to learn from what has gone before. It is natural then that economists and others would hunger for ways to test for stationarity.
We know from the "cycle construction" that it is impossible to test for stationarity in general, but how about in the specific? For example, one may be willing just to test for stationarity while assuming an ARMA structure. An ARMA model may be stationary or non-stationary, so there is indeed something to do even in this confined context.
The fist and most famous of such domain-limited test is the Dicky-Fuller Test (1979). DF is in essence a "just a t-test" but the corresponding tables for p-values just happens not to be the famous t-table. The relevant distribution theory actually depends on Stochastic Calculus, and we may chat about this if there is time. As a practical matter, one just uses S-Plus to find the relevant p-values.
The Unit Root code fragments explore the augmented Dickey-Fuller tests and comment on some examples described in Zivot and Wang. In the example for log-exchange rates and for stock prices we fail to reject the null hypothesis that there is a unit root. For stock prices this is certainly no surprise, but for exchange rates it may not have been expected. Such economic ideas as purchase price parity might have pointed toward stationarity.
Still, for PPP to come into play, one needs to deal with the separate inflations in the two countries. As the example of Brazil shows, one can have something close to PPP yet have exchange rates that are flamboyantly non-stationary. In general, emerging market exchange rates can be much more violent than one might imagine a priori, and one week moves of 5 to 10 percent are not uncommon. This plays havoc in the short term with emerging market asset returns, but "washes out in the long run" --- if we believe in that sort of thing.
More Caveat than Usual
As much as one wants to test for non-stationarity, our technology is not particularly compelling. I expand on this in a little"cultural" piece on unit root test.
Sidebar: Algorithms for the ARMA(1,1) Etc.
The ARMA(1,1) model cannot be fit by classical regressions because we don't observe the errors explicitly. One way around this problem is to use an iterative algorithm that uses successively smarter residuals to stand in for the errors. This is not the algorithm that is used in S-Plus, but it captures some of the features of the algorithm that S-Plus does use. We'll discuss the algorithm briefly.
Sidebar: Performance Measures
A relatively recent technical report points out that all of the classical measures for inventor performance pretty much tell the same tale. This is not shocking news, but you should still skim the paper for a review of performance measures and their uses. I'll have a few methodological comments in class.
I also have an older summary of the basic facts about performance measures --- and s look at their Achilles heal. Of course, there is always the venerable Wiki, but I find many things in their Sharpe Ratio piece that need to be fixed. The Sharpe ratio piece at MoneyChimp is better but it still has misstatements. The portfolio calculator at MoneyChimp is also instructive. The "optimal" portfolios are amazingly sensitive to your choices of parameter values ---- and their default choices don't look too good to me.
Sidebar: Leveraged ETFs
We'll look at some of the logic of leveraged ETFs. In particular, we'll look at what the Kelly Criterion, Volatility Drag, and Sharpe Ratio can contribute to the conversation about these weird assets.
Sidebar: Junk Bonds and Treasuries
"Well-informed investors avoid the no-win consequences of high-yield fixed income investing." — David Swensen, Unconventional Success
It takes a brave man --- and David Swensen is one --- to nix an entire asset class. Still, in Unconventional Success he is highly critical of corporate bonds in general. His "no-win" critique is based on the observation that corporate treasurers know more about their company than anyone on the outside, so they will always make more informed judgments about new issuance or about calling in of earlier issues.
This is a valid observation, but it is very much a non-equilibrium argument. A "price is right guy" would argue that bond purchasers also know this asymmetry and they insist on being compensated appropriately for this risk.
The flip side of Swensen's argument is that US Treasuries are a very special asset class. There is no default risk and the bonds are not callable. They therefore provide insurance against unanticipated deflation --- or panic. In the crash of October 2007 to March 2009, this insurance did pay off nicely --- at least at first.. At the crisis matured, the treasuries went back up in yield and a big slice of the gain was given back.
When we turned out of the crisis in March 2009, the corporate bond market led the recovery and junk bonds did very well indeed. Best of all were the bank trust preferred shares, which are arguably the junkiest of fixed income investments.
Admittedly, this is just an ex-post review, but the outlines of this pattern have been seen many times before. I would not be surprised to see it again, though I hope I don't.
Sidebar: History Channel Factoid on Market Manipulation
Just prior to the Allied invasion of Normandy on June 6, 1944, it seems that as part of the pre-invasion deception, there was a Swedish stock market rally that was rigged up by the Allies. The theory was that this rally would be interpreted by the Nazi's as occurring because of Swedish anticipation of an Allied invasion of Norway. The Allied intention was to keep the Nazi divisions in Norway pinned down in defense of an invasion that would never come.
I do not know if this story is true, or if it is even widely believed. . It may also be just one of many war time market manipulations. For example, it is well documented that various deceptions were ably conducted by the Belgian royal family to keep uranium ore from moving from the Congo to Germany.
Day 12: Martingales, Probabilities, and EMH
For 21 October 2009
We will discuss the every useful notion of a martingale. Martingales were originally introduced to provide models for fair games, but they have evolved to become what many people regard as the most important notion in all of probability theory. The plan will only require a few intuitive observations about martingales before coming up with some wonderfully concrete results, such as the famous formula for the probability of ruin (i.e. losing all you money).
Martingales help on think a bit more precisely about the EMH or the ways one might measure the extent to which a money manager may have significantly out-performed the market --- or not.
Sidebar: The 200 Day MA of the SPY
Go over to bigcharts and take a look at the SPY along with its 200 day MA, the most classic of all technical tools. The strategy of being long the market only when it is above its 200 day MA has long been known to have historically out-performed pure buy-and-hold.
Nevertheless, this achievement is not given very much credit because most of the juice came from just one special period.It turns out that the special period came to be called the great depression.
Sidebar: Confidence --- of Consumers and of Others
Incidentally, the Wiki article on the great depression observes that concerning the causes of the great depression, "The only consensus viewpoint is that there was a large-scale lack of confidence."
The good news is that we now have structures in place (like the FDIC) that should keep consumer confidence from hitting the tank, as in the picture above of the run on the American Union Bank. We also have unemployment insurance, which keeps people consuming even if they suffer a job dislocation. The bad news is that we have also have a spaghetti bowl of linked derivatives that make everyone quite uncertain --- even about traditionally secure institutions, such as the Hartford and MetLife insurance companies.
There is an index of consumer confidence that is of high scientific quality, but it comes out only monthly, so it is always yesterdays news from the view of the financial markets. Gallop does its own consumer confidence poll. It comes out approximately every two days.
Incidentally, another 2008 survey suggests that young adults (19-29) are more pessimistic about the economy than other age groups. They aren't necessarily pessimistic about their own prospects, but they do think things were much rosier in the 1990's.
Sidebar: ProShares and Volatility Drag
ProShares (and its competitors) are designed to provide the holder with two times the daily returns on the benchmark asset. Because of volatility drag (the famous "mu minus half sigma squared" formula), such an instrument is guaranteed to provide less than the twice the return of the underlying over any longer period of time.
Sidebar: XOM and USO
While at bigcharts, take a look at the relationship between the price of oil and the price of Exxon-Mobil. To me, the three year chart for XOM and USO (the oil commodity ETF) is at least a little mysterious. When you compare XTO and USO, there is a more intuitive relationship.
Sidebar: Oct 10, 2008 VIX hits 70 and Dow Interday Swing is 1000+
What can you say? This was unprecedented. The thermometer may not be "broken" but the logic behind the thermometer is severely torqued. With sigma at 70, a minus 1.5 simga event means you could snap up the total market with just your lunch money.
If you must search for a silver lining, have a line from a recent Schwab report: "Following each move above 40 since 1990, the S&P 500 had consistently positive returns one month (8.7% average) and one quarter (11.3% average) later, although the performance was mixed in the very short term."
Sidebar: Historical vs Implied Volatility (Oct '07)
Here is a plot of annualized realized volatility based on thirty day trailing data and the annualized implied volatility "based" on the 30-day at-the-money options. These track better than I thought they would. The WSJ source comments: "We're running a big fever --- the thermometer is not broken."
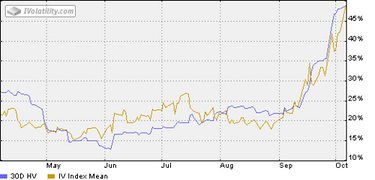
If we consider for a moment the art of honest graphics, one should note that this graph may suffer from what I call the "histogram cheat." Classically, this is the ruse where you overlay a density and an empirical histogram and observe that "it looks pretty good." For example, this device was trotted out in the Ljung-Box paper. An experienced analyst knows that such superpositions play tricks on our eyes.
In general it is much better to look at the spreads (i.e. the difference in the two curves) or at the multiplicative analog of spreads --- the ratio of the two curves. When put under such a microscope, you start to see that even this "surprisingly good fit" is actually pretty bad.
Day 11: Betting on an AR(1) and Introducing the EMH
For 14 October 2009
The first item on the plan is to develop the conditional Kelly Best sizing formula for the AR(1) model. We'll then do a Fermi calculation to gain some intuition about this formula. I'll also stick my neck out and suggest how you might go about guessing reasonable values for mu and sigma when confronting a common stock. This will also introduce some room for discussion of the logic of asset returns.
The next item is to take a long look at Homework 5, where at last things start to get serious. This is a homework where you get to exercise some honest personal judgment. There are lots of choices to be made, and you get to make almost all of them. We have no class on Monday October 19 (due to Fall break) so Homework No. 5 will be due on Wednesday October 21. This gives you a big chunk of time to devote to the HW, if you are not otherwise occupied.
If you attempt the optional part of the assignment, you really do need to keep you eye on the "Fermi-type" reasoning. The general algebra may be "optimal" in some sense, but you will find that a back-of-the-envelope calculation will provide all the honest guidance that you need. This is especially useful --- for interviews, or if the algebra never "converges."
The second part of the agenda is to open the conversation about the Efficient Market Hypothesis (EMH). Everyone seems to know what this is all about until someone says --- "great, lets write this out as mathematics."
At that point almost everyone starts to become uneasy. The fact is that that there are some hard --- and debatable --- decisions that must be made. Our first step will be to round up the "usual suspect." We'll then see what comes out in the wash. Incidentally, I have collected some sources on the EMH that may be useful to you, and you will surely have loads of material from your other courses.
One paper in this collection is Andy Lo's paper on the Adaptive Market Hypothesis. This paper gives a nice introduction to the EMH, the notion of informationally efficient markets, Samuelson's model, and a good many other things. To complement our discussion of utility, we'll look at his presentation of the Kahneman and Tversky (1979) example of risk seeking behavior and the break down of utility theory.
The Wiki article has been greatly improved over the past year, and now it is decently informative.
Finally, whenever we have a free moment, we should discuss the Nuveen Funds. These make interesting series for analysis, even though some of the time series are short (i.e. less than three years). These are not formally dominated assets, but they are pretty bad.
Please don't forget the previous note about the final project due dates.
Incidentally, if you want to prepare for an interview with Google or with a quantitative group on Wall Street, you might work through one of the collections of Fermi Problems. Moreover, if you are a SETI sort of person, you will be well amused by consideration of the Fermi Paradox .
Sidebar: Coaching on Writing
Many of you will end up being compensated to a large degree for (1) your personal presentations and (2) your written presentations. Thus, your future net worth depends to an amazing extent on your ability to maximize the effectiveness of both of these forms of presentation.
Here is a very big hint that works in both of these situations: You should assume that the person you are speaking to someone knows almost everything that you do. This means that you can --- and almost always should --- "jump to the chase. " Trust that your listener or reader can follow you, and trust that there is a ready listening for what you have to say that goes beyond the normal. ( Naturally there will be times when it is right to assume that your listener,or reader, is not quite up-to-speed. In such a case, you'll need to supply the missing background, or motivation, in a way that is efficient but not condescending.
Focus as much as you possibly can on what you have that is new, special, or out of the ordinary. When you write for a general audience of the craft is to make sure (without insulting the audience) that the" ordinary" is indeed collectively assumed.
In most cases (say in our class), this is not a problem.
Historical Sidebar: October 2008 --- The VIX Goes Parabolic
If you just gave me this chart without telling me that it was a chart of the VIX, I would not have a strong view about it being stationary or not. If force to make a call, I might even say it was non-stationary. On the other hand, if you tell me that is is the VIX (it is!), then I would say, "It is stationary!"
Is this science, or is it madness? I think it is science, though some allowance for madness seems prudent. The reason I think it is science is that we are right to have strong a priori beliefs about a good many economic phenomena. To believe that the VIX has gone non-stationary puts the options market into a scenario that I can't bring myself to accept. Naturally, we have to consider the possibility that I am just living in denial.
Sidebar: VIX as a Forecasting Tool
As we ponder the current state of the VIX, it seems like a good time to look at an amusing December 2006 paper from Credit Suisse on the use of the VIX as a forecasting tool for market returns. The two graphs on page two are both well conceived. Figure 3 is of the bread-and-butter kind that anyone would produce, though the authors have been smarter about the scale than many are. Figure 2 is more unusual, and I think it speaks quite usefully to a question that you are bound to ask yourself sooner or later. If you think about it, you'll see that a huge amount of computation that went into this one figure.
Over all, this paper does a good job of suggesting the kinds of analyses and the kinds of graphics that contribute to a good final project. As far as style is concerned, the paper is of the chatty, retail, sell-side kind that I encourage you to resist as much as you can. In 434, we favor the cut-to-the-chase style of internal by-side memoranda.
Sidebar:What are you going to believe, and why?
By the early 1990's, a mountain of observational studies supported the claim that beta carotene (stuff found in carrots and such) provides substantial protection against a wide range of cancers. When the results of one large clinical trial became available in 1996, the observational studies were set aside as perplexing curiosities, and the medical community embraced the view that supplements of beta carotene do not reduce cancer risks --- and may even increase them. When it comes to medicine, the randomized clinical trial is the gold standard.
Take a moment to read a brief NYTs article that reviews this history and then ask yourself what the message may be for students of financial markets.
Homework 4 Note
With set.seed(31415) some people have received the message that the "optimizer did not converge." This requires very bad luck, but it could just be that 31415 is indeed unlucky. If this happens to you, try another seed and see if you get out of the trap. In either case, include your observations in your report.
Day 10: What to Do When Facing A Favorable Bet
For 12 October 2009
Naturally, we want to discuss the Homework 3 (being returned) and Homework 4 (coming in today).
The Plan for Day 10 then has us review the Law of Large Numbers, and apply it to the attractive but controversial notion of long-term growth rate of wealth. This rate will then lead us to the famous Kelly criterion for bet sizing. We will develop this in some detail. (Purely parenthetically, there is a remarkable article on the "Infinite Monkey Theorem" in the Wikipedia. I think it is delightful for its scholarship.)
For some richer context for the Kelly Criterion, you might want to browse my brief page of Kelly related links. I will add more to this page as time goes on, so you may want to revisit it when you start to think about your final projects.
Finally, we will see how the Kelly criterion relates to a classical paradox of utility theory, the famous St. Petersburg Paradox. As our discussion is unfortunately brief, you might want to look at comments on the Paradox by Shapley and by Aumann.
Shapely argues that it need not be the failure of risk neutrality that causes us to offer so little for the St. Petersburg gamble. Shapely says it can all be explained by counter party risk. This makes a lot of sense to us now considering, for example, how Ambac and MBIA looks like feeble backing for bond insurance.
Aumann argues that any unbounded utility function exposes one to paradox; for Aumann, utility must be bounded to make sense. These papers are brief, lucid, and written by central figures of modern economic thought. Where better could you spend a few minutes of your day?
Sidebar: Quotes with an Economic Spin
I keep a web page of the quotes that amuse me. Since most of my reading is about contemporary economics, statistics, and finance, so are most of the quotes. You might take a look at these from time to time, just for the fun of it. Heck, they may even be educational.
Sidebar: When are the FINAL PROJECTS due?
Your final projects are due on Wednesday December 16 at HIGH NOON. Naturally, you can hand the project in earlier if you like. This date was determined by the 2009 University Schedule for Final Exams. Please note: This is a scant one week after the last day of class, so you really want to have a firm grip on your full project by the time of your "project proposals" on in the last week of class. Most of your proposals will be fine, but some people will need a "mid-course correction" and this is not so easy with just one week.
You will need to submit TWO COPIES of your project: One electronic copy (PDF, file name = you names) is to be sent to me by email and one hard copy is my mail box in Suite 400 of JMHH. If the mail box seems insecure to you, you can slip your paper under my door (447 JMHH).
Pease see the policies page for information about the penalty for late projects, etc. This is very important.
Sidebar: Forecasting the Fed Funds Rate
For people who want to forecast the Fed Funds Rate, it is interesting to note that (in a few recent examples!) the moves by other-than-US Central Banks may provide relevant information. Here is a picture (from the WSJ, 10/9/09) that gets people thinking:
While this is worth thinking about, it's too short a story to have much statistical meaning to it. For the serious economic scientist, the classical method of estimating the probability of a move in the Fed Funds Rate is (1) to look at the Fed Funds Rate Futures, (2) assume the "price is right" and (3) then back out the probably of a "move". There are some few nuances to this, but they are nicely explained in a piece by the Cleveland Fed.
We used a similar method to estimate the future inflation rate when we examined OSM. We looked at the inflation rate that would be needed for the 10 year TIPs and the 10 year Treasuries to have the same total return. This is a "price is right argument" and it may not be right given that the government has a thumb in the pie. Still, the "price is right" estimate is always the first strawman that we are challenged to beat, or at least to argue around.
Another strawman to throw into the pot is the "long term average" for whatever it is that we are trying to estimate, and a third one is the "a priori average" for the illusive thing we are trying to estimate. I'll give an example of the third idea later when we discuss Blume's beta. Each of the last two themes hearken to a pervasive idea of John Tukey's which he called "borrowing strength."
Sidebar: "Phase Transition and Momentum" (Part Deux)
These are both terms from physics, and, when applied to economics and finance, such terms are often an invitation to foolishness. Still, "often" is not "always". I cited earlier a 2008 PIMCO piece that made the augment that "post phase transition expect more momentum" .
In 2009, we get to see how this thesis plays out, and so far, the story seems credible.
Both in the down draft to March 2009 and in the recovery after March 2009, we have seen an astounding amount of momentum. In the recovery phase, we have also seen a big pay out to "high beta" assets, with the classic emerging market and small cap growth themes paying off big time.
I'm definitely writing down in my personal play book "Post some major transition (e.g. bubble crash) expect more momentum (positive or negative) than you would normally expect". Due to the awkwardness of just living on one sample path of economic history, we'll never have an honest test of this rule, but I think it is still more wise than foolish to look at the rule for guidance.
Sidebar:Richard Bernstein's Growth vs Value Thesis
In 1995 Richard Bernstein published Style Investing, a trade book that looked at questions such as "When do growth stocks out perform value stocks?" His most interesting thesis was "Contrary to popular belief, growth investing requires a rather pessimistic view of the world, while value investing is a more optimistic view" (p.72).
Bernstein came to this view by looking at performance prior to 1995, but the developments of 2009 so far seem consistent with his thesis. When the market turned in March of 2009 growth out performed value, and small cap growth was the best of the "six styles." Bernstein's argument was that "when growth is scarce it sells at a premium." By October 2009 the picture was more mixed --- again consistent with the optimism/pessimism thesis.
The alternative interpretation for 2009 is that we saw a sharp rebound from the March lows and the high-beta stocks just got their fair beta multiple of the positive returns. Since growth stocks, especially small cap growth stocks tend to be high-beta stocks, there is no way (or alt least no easy way) to decide between the Bernstein thesis and beta thesis. The good news as far your the playbook goes is that either thesis tends to point you in the same direction.
Sidebar: Coal Prices
The EIA has a site that tracks coal prices. Coal prices, like other commodity prices, may seem like they should be decently predictable. After all, both supply and demand are indeed decently predictable. Nevertheless, markets being markets, profitable prediction is no piece of cake. Hold that thought for a minute and take a moment to learn a bit about coal prices.
It's really amazing (to me!) how greatly the different types of coal diverge in prices as one varies BTU content and SO2 content. Just look at the spread on Illinois vs Powder River Basin prices! Finally, contemplate the observation that coal prices have been pretty stable, but coal stocks have taken a 50% nose dive.
By the old "it's all about expectations" mantra, this may be reasonable --- but maybe it is not!
Addendum: A 434 Alumnus points out that US supplies (as reported by EIA) are relatively stable, but there have been supply shocks to international supply due to new production coming on-line in Australia. He also notes that PRB coal is not exported and used almost exclusively for electricity production.
Day 9: ARIMA(p,d,q): Differencing, Estimating, Simulating
Posted for 7 October 2009
Our first step is to consider "differencing" as a tool for getting stationary time series from a non-stationary time series. This is a simple but useful trick. Also, when we look at continuous returns we are basically looking at the difference sequence of log price. This is one reason it is often (but not always) safe enough for us to assume stationarity of a return series. Price series themselves (or even log price series) are rarely stationary.
The main part of the plan is to go over the S-Plus tools for fitting ARIMA models and for Simulating ARIMA models. Important for us will be the use of arima.sim for simulating ARIMA series and arima.mle for fitting ARIMA series. Naturally, we'll also discuss the new homework HW4 as well as whatever else shows up.
Wisecrack du Jour
"I like two positions: Cash and the Fetal position." --- Jeff Macke, Fast Money, CNBC, (9/29/08)
Sidebar: Gray Monday, Sept. 29, 2008: Dow Drops 777 Points
Congress rejected the Economic Recovery Act and the markets responded with disappointment. The much-watched Dow-Jones Industrial Average was off "only" 6.98% while the Standard and Poors 500 Index dropped 8.81%. You might wonder which number best reflects economic reality. The answer is simple: the Dow is an out-dated, deeply flawed, index.
The Gray Wednesday of 2008 took place in a much different environment than the Black Tuesday of 1929 which rang the bell on what became the Great Depression. There a lots of reasons why "it is different this time." In response, one wag observed, "Yeah, Lehman Brothers survived the Crash of 1929."
A more reassuring difference is that the world's central banks are much more well-informed. Unfortunately, legislators don't seem to have made much intellectual progress. Another difference is that Gray Wednesday took place in the context of a reasonably priced equity market, thought perhaps not a cheap one when the then current inflation rate of almost 5% is taken into considered. What was really different in 2008 is that it was a credit (and credit derivative) driven sell-off.
The VIX also hit 48, which was not a record for the time, but it was close. As I commented on the blog at the time "The bottom line is that --- up or down --- you can expect big time volatility." Eventually the VIX went on to hit 88%, which skirts perilously close to a mathematical inconsistency once one of the definition of volatility.
We know now that the bottom was not found until March of 2009 with the SP500 at the devilish 666, down from an October 2007 high of about 1550 --- a stunning 57% decline in about 15 months. Already there are more than one hundred books written about these turbulent times, and the river has not crested.
Sidebar: Inflation and Stock Market Returns
I'm sure that many of you have a copy of Jeremy Siegel's Stocks for the Long Run. In the third edition (p. 196) there is an interesting chart that relates inflation and the real compound annual return on stocks. He takes the inflation rates, bins the years into five bins, and on the y-axis plots the average of the real returns for the years that fall into this bin. It's an instructive analysis, but relevant to our earlier discussion on graphics, I would much prefer to look at the plain vanilla scatter plot, perhaps with the points coded for decade.
Siegel's graph makes the clear inference that inflation over 4.4% is bad news for equity returns. The scatter plot is likely to be less clear yet more informative.
Sidebar: Listed Assets with Near Zero Beta
If you search for single assets that have near zero beta, you turn up some very odd birds. One that I find interesting is WESCO. It trades very thinly --- which is explained in part by being 80% owned by Berkshire Hathaway. WESCO is run by Charlie Munger, Warren Buffett's long-time sidekick. Munger is a great story teller and much can learned from the tales that he has told.
Sidebar: More Data or More Bayes?
What is the best way to think about what may be the likely returns to a long term holder of stocks? One model is to look back over all of the available data (say to 1880 in the US, or farther back in the UK) and look at the mean and variance as if annual returns were IID? Is this smart? Can one do better? Why do we believe what we believe? This is a huge discussion and it may lead nowhere, but it really is one of the issues that perplexes me most. It also relates nicely to many other discussions.
Cultural Sidebar: Lynch? But Not Peter or Merrill
Just to distract us from the agony of day-to-day developments, we'll take a moment to look at a statistical time series that is fortunately remote from us --- both in time and culture.. The series in question deals with a sad part of American history --- lynchings in the Southern States from the period of reconstruction (1870's and 1880's) until the depression (1930's). The key figure in the article has suggested to some that there was a relationship between cotton prices and the number of lynchings.
These series set some traps. It would be easy--- and wrong --- to trot out an analysis that ignores: (1) spurious regression in time series (a topic we take up later) (2) the notion of cointegration --- or the lack thereof (another future topic) or (3) the probably poor quality of the data --- not of cotton prices, but surely of lynchings --- the reported number of which were under the political control of the states.
Even given the scholarly source of the data, I view it as quite possible that the recorded number of lynchings could easily be off by a factor of two (especially on the low side) in any --- or even most --- of the given years. Lastly, the use of annual data makes the series very short. Given the humble efficiency of our methods, they are certainly too short for one to address honestly the issue of co-integration. Oddly enough, the whole puzzle does echo an interesting issue in behavioral finance --- namely the constant stalking horse of confirmation bias.
Important Note : WRDS1 Down? No, New Address!
Here is the news from WRDS:
"The WRDS1 website is in the process of being replaced. It is being replaced by our new website:
http://wrds-web.wharton.upenn.edu/wrds
As with the WRDS1 website, anyone who has a Wharton account can log into the new website with their Wharton username and password. The new site has the same functionality of the old site as well as some new, better features. If you would like to learn more about the new website, you may find our "Overview of the new WRDS website" video helpful. You can watch it online at: http://wrds-web.wharton.upenn.edu/wrds/E-Learning/_000Video/Overview%20of%20the%20New%20WRDS%20Website/index.cfm. In addition, we would be happy to answer any questions you have."
Day 8: MA(q) and ARMA(p,q)
Posted for 5 October 2009
Our first task will be to survey your discoveries from HW3. If all goes as as usual, we will find that --- except in the luckiest of circumstances --- the daily returns for common stocks are not normally distributed. This is the first of the so-called stylized facts that we will discover about asset returns.
The non-normality of returns is often ignored by practitioners --- sometimes mindfully and often times thoughtlessly. We'll try to remain mindful of the non-normality of returns, but on many occasions we'll have to join the thoughtless herd and assume normality --- even when we know it is false.
How do we live with this situation? Well, first we admit that it is a goofy thing to do and then we just keep looking back over our shoulder to see if something has really gone haywire.
The rest of the plan focuses on the theoretical features of the general ARMA(p,,q) models, including the issues of general issues of stationarity, invertability, and identifiablity.
Sidebar: Test or No Test for Stationarity
One theoretical point (that we may or may not cover) is the construction of a stationary process that essentially proves the impossibility of testing for stationarity in the broad sense in which we have defined it. We will later discuss tests for stationarity in more narrow senses, and it will be up to you as a modeler to decide which description best reflects your world.
Sidebar: Tests vs QQ Plots
When we use a QQ plot to compare a sample with a theoretical distribution, we see the FULL TRUTH in our data, and when we us a test (like the JB test for normality) we really apply a microscope to some specific features of our data (e.g. skewness and kurtosis in the case of the JB test).
It is natural that the full truth is harder to "understand" than the partial truth of a p-value.
Also, throughout statistics, longer tailed distributions are more troublesome than distributions with normal-like tails. This inevitably shows up when we try to compare asset returns with t-distributions of various degrees of freedom. We can tell easily enough that a t-distribution is more appropriate than a normal distribution, but by the time we try to decide which t-distribution is "best" we may start to face more or the truth than is personally comfortable.
Sidebar: Phase Transition and a Vote for Momentum
There is a think piece from PIMCO that uses some metaphors from physics in the context of financial markets. Normally I dislike such metaphorizing --- but normally I do like the PIMCO pieces (especially those by Bill Gross and those by Mohamed El-Erian). One take-away from this article is that after passing through a "phase transition" the likelihood of momentum starts to exceed the likelihood of mean reversion. There do seem to be some historical examples to support that point of view, so it is worth contemplating, even if a satisfactory statistical confirmation is unlikely.
Sidebar: Ergodic? "I don't need no stinkin '' ergodic ... "
You might want to take a look at an amusing popular essay about ergodicity. It is fundamentally correct, but I can't honestly say what one would infer from the article, if one did not already know the formal meaning of ergodic. Still, it is consistent with our definition and it possibly adds some intuition.
There are several layers to this puzzle. John von Neumann once said: "We don't understand mathematics, we just get used to it." Well, the notion of "ergodic" is somewhat the same. We can master the definition, but mastery of the real notion just takes lots of "getting used to."
Incidentally, John von Neumann also had a role in the use of the word "entropy" in information theory. Claude Shannon asked him if he though the use of the term was appropriate, and von Neumann said "Go ahead and use it. Nobody knows what entropy means anyway."
Well, about von Neumann --- John Wheeler once said, "There are two kinds of people. Johnny and the rest of us."
Finally, the definition of ergodic in Z&W is not 100% up to snuff. Their definition and ours will coincide for Gaussian processes, but even our first brush with real asset data tells us that in our business we can't expect to see too many of those.
Sidebar: Too Much Company Stock in Employee 401(k)'s
The WSJ catches up on a point made in class last week: It's pretty stupid to hold your company's stock in your 401(k). If you get it at a discount, take it (maybe) but when you can trade out of the discounted stock --- do it! Just by working for a company you already have much more than a market weight in the company, to pour in more money rarely makes much sense. You should probably even underweight your company's industry.
The only exception I can imagine to this "rule" would be for C-Level executives who need to "fly the flag." These executives should look into the possibility of hedging the positions that they are essentially "forced to hold." Giving the "Caesar's wife" constraints such executives face, this may not be easy.
Sidebar: Institute of Supply Management Survey (PMI)
The PMI (Purchasing Managers Index) is one of the numbers one can use to measure year over year change in business activity. It is survey based, and all surveys have lags of various sorts --- the PMI's may be shorter than most. There are also data quality issues that can change over time. Also just looking at peaks and troughs, it is hard to argue that it is a leading index --- or at least it does not seem to lead the stock market. The Wiki piece on the PMI seems to have been vetted by ISM, it's not particularly critical.
Day 7: The Full AR(p) model --- Features and Choices
Posted for 30 September 2009
The main part of the plan is to introduce the general AR(p) model. We'll discuss the historical contribution of Yule, his equations, and the ability to pick up periodic behavior, such as the 11 year cycle one finds in the famous sunspot data.
One issue of clear practical importance is that of choosing an appropriate value of p. In general, this is a problem in what is called "model selection." We'll look at one natural approach based the so-called "partial autocorrelation function."
We'll also open an important conversation about "parsimony" in models. Is this a miracle, credo, or a practical and well-founded heuristic?
We'll also do some mathematics --- in part because it is honestly important for understanding the AR(p) model and in part because I want to remind everyone that --- however powerful simulation may be, one should never forget the value of analytical insight. More times than not, it is an analytical insight that tell one "what to simulate."
After warming up the old partial fractions, we'll find a useful criterion for stationarity in an AR(p) model. In theory this will be nice and explicit, but when turned back to practice we'll see that it is at least a bit schizophrenic. We'll also do that Wold calculation that we didn't quite get to last time.
Sidebar: All is Well with Data Import
The piece on using WRDS and data importing into S+Plus seem to be fine, despite my cautions on Monday My installation of S+Plus had a bug and the dialog screen did not show up. I did a reinstall, and everything worked fine. You (probably?) will have no problems.
Sidebar: "Insurance vs Consulting"
This is a a presentation of the Wharton Actuarial Society on Thursday October 1, 7pm-8p in JMHH F65.
Sidebar: Goofy Asset --- TIAA Real Estate Fund
If you want to consider a truly unusual asset, you need go no further than the TIAA Real Estate Fund (not to be confused with a mutual fund run by TIAA which is not so strange). We'll just look at the raw figures --- you can build your favorite graphs. This example brings up one of my favorite themes: just because lots and lots of assets exhibit some generic features, it does not mean that all assets have that generic feature. These "failures" are really the most interesting assets.
Day 6: Data Confronts the "Normality Assumption"
Posted for 28 September 2009
An important part of the plan is to go over the piece on using WRDS which also covers the importation of WRDS data into S-plus. We'll also discuss HW1 (going back), HW2 (coming in), and perhaps go over the newly assigned HW3.
Scheduling Note: It is a tradition in 434 to treat attendance the day before Thanksgiving as optional. I do hope and expect that some people will be around. We will have class, but those who are eager to get to Grand Ma's house can scuttle off without worrying about missing anything essential.
Sidebar: Pondering the Mysterious Role of Assumption in Models
We'll often simply assume that a series is stationary, though of course we won't be silly about this.
Most price series are clearly non-stationary, and there are even return series that we can't call stationary with a straight face. Nevertheless, except for isolated (but important!) periods, many (but not all) asset return series have behaved in a way that stationary enough for us to courageously push ahead and "assume" stationarity.
Later we will discuss some "tests of stationarity" but to tell the truth, these test are so limited in their power and applicability that they do not fully deserve the name. They are more technically known as "unit root tests" and they help one to discover when a random process "looks" like a random walk --- a vigorously non-stationary process.
The issue of Normality
Normality of the log-price change and independence of log-price changes are assumed in the development of the Black-Scholes model, a model --- and subsequent theory --- that is of rhapsodic beauty.
It is even a useful theory --- when carefully applied.
Still, as we experiment together, we will find that there is seldom much empirical encouragement for us to assume normality of returns (or differences of log-Price).
We'll start addressing the normality part of this set-up with help from the Jarque-Bera and Shapiro–Wilk tests of normality. For a purely seat-of-the-pants practical approach, one still does well by eyeballing the qqplots.
While we are at it, I should underscore that It is important that everyone in the class start sharpening their understanding of the theoretical side of our work --- even as we keep marching along with the practical side. It really is nonsense to suggest that one has a "practical" understanding without a "theoretical" understanding. We'll see lots of examples of the foolishness that can result when one loses track of what he is talking about.
In particular, make sure that your definitions are rock-solid.
For example, write down the definition of independence of two random variables.
Hint: if you use the word "correlation" you have a gap in your knowledge that you should plug right now. What is required here is a very simple formula --- nothing else is genuinely true or complete. To be brutal about it, anything else is simply wrong. It may have mitigating virtues, but it is still wrong.
My concern is this --- if your understanding of the fundamental notion of "independence" is shaky, then the more subtle notion of "martingale" which we well use shortly must be incomprehensible. Without understanding the ideal of a martingale one is almost barred from a fully adult conversation about market efficiency, gambling systems, and lots of other great stuff.
Suffice it to say ---- understand the definition of independence as deeply as you can.
Sidebar: JB in the Wiki --- Some Instructive "Slips"
If you are logically fastidious there are some irksome errors in the Wikipedia description of the JB test. These offer us a useful opportunity to illustrate some important distinctions. Everyone will understand them --- and afterwards they will be part of a small club that does understand them. It's worth the price of admission. Basically, this is the club where "you know when and where you need a hat."
Incidentally the Wikipedia article on Shapiro-Wilk is valid, though it is a too obscure to be directly useful to us. Nevertheless, there is an intuitive description of the SW test that we will discuss in class.
JfF Sidebar: Which Bill has the Shortest Life Time?
Or, how much currency is in circulation? Is most of this in the US or outside the US? All of these, must-know trivia questions are answered by the US Treasury.
Weekend Questions Regarding HW2.
Posted 27 September 2009
I've had a flurry of emails asking "this and that" about HW2.
The bottom line is that you should try a few k's and try a few T's and look as thoughtfully at what you get. There is no reason to be super fancy. Just try to be logical and --- as far as possible --- methodical. All of our exercises will call for you to make decisions about certain details. You should just go ahead and make the decision. If the decision is an important one, you should mention this in your write up and explain the reasons for your choice.
Naturally, if you what to go beyond the basics, I encourage you to do so. Even if you want to try something super fancy, by all means go ahead and do it. You have my permission from here until the end of time.
In general, when you have a homework in 434, think of it as being like a project for a manager of a quant group. You always want to do what has been requested, and then if you have time and energy go ahead and engage the other possibilities that occur to you. We will always go over the assignment in class, and it it great to have people who have done different things.
Addendum: On Monday we'll learn a bit more about the Graphics tools in S-plus. In the meanwhile you may want to look at a little micro note on graphics that I wrote. Also, you'll want to take a look at the Sidebar on suppressing printing for a graphical function.
Sidebar: Suppressing Printing in acf()
Many functions that create plots also create other useful stuff. To get that useful stuff without creating the plots (and hanging up S+Plus), you need to use the "plot argument". If you look at the help file you'll see the default for plot is true, you need to set it to false: plot=F. Note the default below (from the help file).
acf(x, lag.max=NULL, type="correlation", plot=T ...)
Day Five: Ljung-Box, S-Plus Code, and the Wold Decomposition
Posted for 23 September 2009
Here is a quote from the 434 Blog from just a few days more than one year ago:
"Some comments are certainly in order on the truly astounding transformations that are taking place in the financial markets. There are lots of ways in which we are not in Kansas any more and it would be foolish to ignore these astounding events --- however much we love stationarity".
That was then, this is now. There are two point to keep in mind. The first is that you can tell when a seismic shift takes place, and one would be stupid, stupid, stupid to ignore it. The bottom did not occur for another six months. The people who ran for the lifeboats did the right thing. The second is that such shifts are exceedingly rare. The old story is "they don't ring a bell when a Bear market begins" --- the new version is "they USUALLY don't ring a bell..."
Still, most markets are --- by definition --- normal markets, and this brings us to the plan. We lock in the notion of an autocorrelation test and specifically engage the Ljung-Box test --- the technically superior version of the more logical Box-Pierce test.
The original paper Ljung-Box (1979) requires more background than you are likely to have at this point, but you can still benefit from taking a quick look. Figure 1 (page 299) especially tells a good tale. It contrasts Chi-squared approximations of the Ljung-Box and Box-Pierce statistics, and we see from the plot that Ljung-Box is the winner. Even though from the point of view of pure logic, the now out-dated Box-Pierce statistic is dandy, we have to concede that from the point of view of the Chi-squared approximation, the Ljung-Box statistic carries the day.
We'll explore the Ljung-Box statistic with help from the S-Plus Finmetrics tools that are bundled into the so-called "acf test" which covers among other things our favorite Ljung-Box test. Specifically, we'll check out the code example and look the results and a relevant picture : MSFTretACF.
We will also develop ---- in the context of our poster child AR(1) model ---- an elegant theoretical tool called the Wold representation. Along the way we will also introduce the lag operator and the so-called "operational method", a magic trick that is useful in many parts of applied mathematics. It looks goofy, but it works --- and it can be justified rigorously by fancy algebra which we will not do.
Finally, we'll also go over the new homework and deal with any logistical issues --- such as getting all of the partnerships formed. BTW, we'll look at my favorite example of why the "partners" set up works so well.
Hey, if we have a moment, we may have some fun with the translation functions of Google. Remember those little flags?
Sidebar: Simple Experiments with set.seed and rnorm
Given almost any question about S-Plus, the way to get the definitive solution is just to run a little isolated experiment. Here is one that is motivated by our discussion of set.seed.
Sidebar: Multiple Comparisons
My colleague Shane Jensen points out a nice example of the problem of multiple comparisons. This is a generic plague on statistical investigations, but his DEAD FISH example is especially compelling.
The researchers did an fMRI of a dead fish exposed to several mental tasks. Without correcting for multiplicities, several regions of the dead fish's brain pop up as active. This is sad in many ways, but saddest yet for those whose wagon is hitched to the burgeoning field of dead fish studies. We'll deal more with the problem of multiple comparisons later, but the lesson is always timely and the example is too good to risk forgetting.
Sidebar: Teams and Partners
On the first day of class, I made a strong pitch for the value of working with a partner. I also gave some rules: (1) you can work by yourself if you want and (2) the teams cannot be larger than two persons.
Next class time, I will ask for a show of hands of people without partners and leave a little time at the end of class for team formation. Also, in class I will give an example of a task such that almost all individuals fail and almost every pair of individuals succeeds. Teams really do contribute to quality.
Day Four: Autocorrelation Functions and Simulation Tools
Posted for 21th September 2009
The first order of business is to discuss the incoming homework, which I trust went well for everyone. There may also be some logistical issues of partnership formation, etc.
We'll then introduce the notion of an autocorrelation function, which is our front- line tool for looking for dependence in a time series. After pondering the general definition (valid for any stationary series), we will work out an explicit formula for the theoretical autocorrelation function for the AR(1) model. This calculation will also make it stunningly clear why rho must have absolute value less than 1 for our model to make sense.
We'll then look at the S-Plus function for computing the autocorrelation function. This will provide an opportunity to discuss the nature of S-Plus objects and to look at the relevant extractors. We'll look at
We'll also discuss an example application of the Finmetrics tool arima.sim which can be used to make quick simulations of a large number of models. We'll look at the code, but it is much more fun for you to cut and paste in bits at at time to see how it works. Still, we will look at the main picture.
As promised, the new homework has been posted, but we'll go over it next class time.
As I mentioned in class there are numerous S-Plus tutorials on the web. The hard part it to find one that is really tailored to the needs of our class. For the non-time series basics, I think one does well to look at the tutorial of Konstantinos Fokianos of the University of Cyprus. The S-Plus installation also has useful PDF manuals. We'll look harder at those later. Finally, we have several new sidebars that are worth some attention.
Sidebar: Sign Prediction and Noise in AR(1)
Here is a good question to ponder. If you fix rho (say at 0.3) in the AR(1) model, but you make sigma huge, won't that really mess up your ability to predict the sign of the next period returns? Note that if you think about regression where the model is given by y=a+bx+epsilon, if you keep beta fixed and jam up sigma, you lose any chance for predictability of the sign of y for a fixed value of x.
How does the AR(1) model differ from the regression model?
Hint: How does "changing the scale" change rho in the AR(1) model? At a deeper level what is going on here is related to dimensional analysis which really is one of the most fundamental tricks in applied mathematics and engineering.
Once you have figured out what is going on in the AR(1) model with mean zero, you should humble yourself by then considering the case of a model with non-zero mean. Say, for example IID returns with mean mu and standard deviation sigma. Now, what does changing sigma do here to your ability to predict signs?
Finally, how can you put both of these insights together into one "package"?
Sidebar: What to Hand-in for HW 1.
You need to hand in one hard copy per team. Please don't give me the assignment of either printing out your hard copy or of stapling it. If you don't have a good stapler, buy one. Unlike cell phones or almost anything else, a good stapler will last you a lifetime.
Sidebar: Hint on S-Programming (and the Editors)
The interactive way that S-Plus works is nice in many ways, but when you write functions you probably don't want to do this in an immediately interactive way. You can use the editor in S-Plus --- this is the integrated programming environment way to go. Also, the poor-man's approach (which I still use most often) is to write the function or program in a text editor (such as Notepad) and then just copy and paste into the S-Plus command line.
Sidebar: Coaching on Coding
Naturally I cannot look at your code examples individually, but I can give you some generic hints.
Many errors are caused by "boundary issues" --- that is one somehow misuses the range of a vector, or a sum, etc. Other times there are misunderstandings of a function. Here you might want to use help(rep) to make sure you understand that S-Function. Also, for debugging there is some generic advice: (1) test the pieces of your code individually and (2) do something like a "trace" --- that is, print out lots of intermediate results to see if the program is really doing what you want it to do at each step. Also, look at the next sidebar.
Sidebar: Debugging Simulations --- and Using set.seed
When we do a simulation, we are not using honest random numbers, we are using pseudo-random numbers. When you call a function like rnorm(1) to get a "random" N(0,1) observation, the function looks at a special hidden variable called the "seed" and calculated a deterministic function of the seed, then it changes the seed in a deterministic way. If you want to exactly replicate a simulation, you can use the function set.seed to force the "seed" to have a specified value.
For example, if you issue the command set.seed(314159) then call rnorm(5) you will get five observations that start grow out of the seed 314159. Any subsequent calls to rnorm will start with the "current seed" --- so, to have a replica of the first five that you got, you would have to do set.seed(314159) again.
Check out help(set.seed) or look at the learning module from UCLA that I found with just a little searching.
Day Three: AR(1) --- Simulation and ML Estimation
Posted 16 September 2009
We'll cover the day 3 plan, attend to any question on the Homework No. 1 Assignment, and work a bit with S-Plus, including the examples of functions and loops in a baby AR simulation.
Our main theoretical task will be to introduce the notion of a Markov process and to note that AR(1) is a leading example --- along with its even more famous friend, the random walk.
We'll also review the notion of maximum likelihood estimation and use that principle to obtain explicit formulas for estimates of the AR(1) parameters. The only "tricky" part of the process is that we really only get estimates that are approximately the MLE.
Important Note: Everyone will eventually need a Wharton account or a "class account". If you are a non-Wharton student, you can get a class account from the class account link.
We also have two sidebars for discussion.
Sidebar: Picking Your Time Periods --- for Wisdom, or for Advertising
It is useful to look at how various asset classes have faired since October 2007, the previous market peak. This also gives the opportunity to discuss a problem that always hangs in the background any time one looks at financial data: "What period does the analysis cover?"
Here we know we are looking at a special period --- we're starting at a peak. A mutual fund prospectus for a fund that started in 1975, or 1982, or 2002 may not always tell you "By the way, this was a fine time to start a fund!"
The facts behind some of these categories do not always coincide perfectly with their names. In particular, you might think of lots of things when you say "commodities" but most commodity indices are very much dominated by oil --- because that really is the relevant market weight if the class is drawn widely enough.
Sidebar: Credit Spreads --- Canary in the Coal Mine?
The message here is not really a time series message in the formal sense of this course, but it is still very informative as data analysis --- and perhaps as financial and economic insight. It speaks very clearly to the powerful concept of the "repricing of risk". We'll discuss this in class.
S-Plus Finmetrics Installation
There are instructions for the installation, but with luck you will be able to close the loop out even looking.
Day Two: A First Model --- Modest but Clear
Posted for 14 September 2009
The first task will be to continue with the development of the AR(1) model, including estimates of the parameters. The AR(1) is a modest model but it has two nice claims to fame. First, it is a model that contains the "strawman" of a pure noise model that underlies many financial results, including the Black-Scholes model. Moreover, depending on the sign of ρ, the AR(1) points us to the fundamental distinction of "mean reversion" versus "trend following."
A central concept of time series is that of "stationarity". This is the property that asserts that as a probability model the series is "shift invariant". We'll look at several layers of this.
We'll use the AR(1) model to deepen our discussion of stationarity. In particular, we will have a nice concrete illustration of the "volatility" versus the "conditional volatility."
The third task is to develop further some further S skills, including the use of loops, conditionals, and functions.
Please note that HW No. 1 is posted in the e-Handouts, and it is due on Monday September 21 . You will also find the more detailed bullet points for today's class in the e-Handouts. There is also a page that offers a guide to some S-Plus tutorials. These are not perfectly directed at financial time series, but they are worth a look.
One Text or Two?
You will only need Zivot and Wang, the big fat blue thing.
The other text (Krause) is purely optional. It is useful if you feel that you would like a more general and perhaps simpler introduction to S-Plus.
Anticipating Day One
Posted 8th September 2009
There will be three main objectives, beyond going over the logistics of the class. First, we'll go over the procedural details regarding homework, teams, and the final projects.
Second, there is at less a little nibbling at our first model --- AR(1), the simplest auto-regressive model and the simplest alternative to pure random noise. Over the course of the term, we'll develop considerable expertise with this model, but the main purpose the fist exposure is to help you calibrate the level of mathematics we will be using --- not too high, but not too low
Finally, we'll have a real-time introduction to S-plus which is our main software tool. Before next Monday you are expected to have installed S-Plus Finmetrics on you PC and to have given it a test drive. You also need to complete the student questionnaire and bring it to class.
Note: There are many S-Plus tutorials on the web. My advice is not to bother with them for the moment. We'll develop the tools that we need as we need them, and there are many S-plus tools that we will never need. Moreover, we will work almost exclusively from the command line, and many of the web tutorials are for lower-level courses that rely on the graphical interface which would only stir in confusion.
Still Shopping? What You Need to Know
If you are still course shopping, I may be able to save you some time.
First, everyone in the course absolutely must have access to a Windows PC on which they can install software. The reason for this is that we will be using the software S-Plus with Finmetrics, and this software does not run on Macs or Unix. Also, the software cannot be placed on public machines. If you are thinking about maybe scraping along without proprietary access to a windows box, I strongly encourage you not to try. From experience, I know this requirement is a deal killer.
Second, I should underscore that this is a course about financial time series. There are lots of applications of time series, and you might think that this course could help you with engineering or medicine or some other worthwhile activity. Unfortunately, that is not the way this course works. Most of our techniques and almost all of our efforts focus on just what is special about financial time series.
Certainly, from time to time, I will mention some of the ways that time series are used outside of financial contexts, but those will just be small parenthetical remarks. The course is about the models and empirical realities of asset returns. If asset returns are not deeply and absolutely interesting to you, then you will miss out on the real fun of the class. Taking the class would be like dancing without liking the music --- possible, but not a good use of one's time.
More Details about the Academic Prerequisites?
We will be writing some programs and dealing with some serious software tools, so it helps if you like such work. We won't be doing a ton of mathematics, but if you can't remember calculus, this is not the course for you. You will also have to have some acquaintance with linear algebra (matrix and vector concepts, matrix multiplication, matrix inversion, notion of matrix rank, etc).
From the beginning we will be using expectations, variances, co-variances, probability distributions, confidence intervals, and multiple regression, so you should have had some solid exposure to all of these. Still, I do not expect that all these tools have been completely mastered. Throughout the course a serious effort will be given to deepening your understanding of the fundamentals. This is a never ending process.
Just how much mathematics, statistics, and "computer sense" you need --- well, it's almost impossible to say.
Strength in one place can make up for weakness in another. In the end, what maters most is whether you look forward to trying your hand at discovering whatever something about the ways that asset prices evolve over time.
Almost without exception, personal motivation, honest curiosity, and dogged commitment will rule the day. These work best when combined with an informed interest in financial markets and a solid self-confidence in your own abilities and knowledge.
What About that First Day?
It's not one you should skip. On of the main tasks will be to sketch out a "mind map" that will provide the big picture for the whole course. We'll also be handling a lot of logistics, such as text requirements and software access. We'll also begin work with S-Plus, our main software tool.
About the Text --- Zivot and Wang Again?
In the Fall of 2009 we will again use the text by Zivot and Wang. I came to this decision, only after much soul searching. We are really only going to use about a fourth of its many pages, but there is no (legal) way that I could think of getting you just those pages that we need. It is not required that you have copy of the book, but life will definitely be easier for those who have comfortable access to a copy. Perhaps getting on copy per team would be a good compromise.
I wish that the book were (1) smaller (2) more focused on what we use (3) more "opinionated" about what works --- or doesn't (4) more generous with coaching about S-Plus (5) more sincere in its engagement of real financial issues. It is sadly a "computer manual" and a bit of a cookbook.
Still, it is a beginning, and one needs a place to start. Eventually, I will write my own text for 434, but there is no chance that a workable version will be available any time soon, even 2010 is a long shot. So, we will have to make do.
e-Handouts
Also see Day 21 Blog re: Specs
First Simulation (code example)
Mind Map of 434 (static version)
Resource Pool
434 Blog for 2007 (w/o pictures)
^ Top |
Steele Home Page |
About This Web Design
Copyright © J. Michael Steele